Improvement #5 - Status Codes with a Vengeance
This is the fifth post in the series 10 improvements in 10 days. Yesterday we made a compact toolbar. Today, we enrich the error details with yet another piece of helpful information.
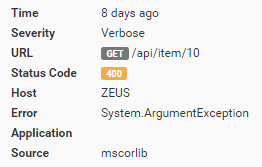
We mainly focus on logging website errors (all major log frameworks are supported as well). All website error have a HTTP status code from the HTTP specification. All of us probably know the most common types of errors like 404 (Not Found) and 500 (Internal Server Error). But what happens when your website suddenly starts throwing 418's (I'm a teapot)? elmah.io to the rescue. With todays improvement, we start color coding HTTP status code with the severity of the particular code:

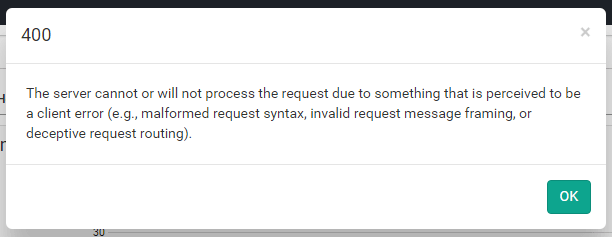
In the example above, the HTTP status code of 400 (Bad Request) is considered a warning and therefore yellow colored. What's even more cool is when you click the status code:

Clicking the status code shows a modal dialog with an explanation of the clicked status code. We have some ideas for improving this dialog even further, but for now it shows the code and description.
The first week of our two week improvement series has passed. A lot of good stuff went into elmah.io in the last 5 days. We cannot wait to implement more improvements next week. Have a great weekend everyone!
elmah.io: Error logging and Uptime Monitoring for your web apps
This blog post is brought to you by elmah.io. elmah.io is error logging, uptime monitoring, deployment tracking, and service heartbeats for your .NET and JavaScript applications. Stop relying on your users to notify you when something is wrong or dig through hundreds of megabytes of log files spread across servers. With elmah.io, we store all of your log messages, notify you through popular channels like email, Slack, and Microsoft Teams, and help you fix errors fast.
See how we can help you monitor your website for crashes Monitor your website
