
Debugging System.AccessViolationException - DllImport hell
For this post in the series Debugging common .NET exceptions, I'll present an exception that will be uncommon for most of you and cause recurring nightmares for the rest: System.AccessViolationException. The exception typically happens when unmanaged code tries to read or write from/to memory that hasn't been allocated yet.
Handling the error
Catching the exception isn't always as easy as you would think. Let's start with an example where System.AccessViolationException is easily handled. The following program throws and catches the exception:
class Program
{
    static void Main(string[] args)
    {
        try
        {
            var intPtr = new IntPtr(1);
            Marshal.WriteByte(intPtr, 1);
        }
        catch (AccessViolationException e)
        {
            Console.WriteLine(e);
        }
    }
}
The WriteByte method in this example throws a new System.AccessViolationException. Catching the exception requires nothing more than a normal C# batch block. The exception typically produces this rather generic error message:
Attempted to read or write protected memory. This is often an indication that other memory is corrupt.
In most cases (at least in my experience), the AccessViolationException is thrown when calling C++ code through the use of DllImport. I remember creating a .NET program back in the day, connecting code to a phone through an old C++ API. The code relied heavily on invoking methods in unmanaged code and handling the AccessViolationException was a required part of writing the program. I guess that's what you get from trying to integrate with old buggy code :D
This does re-create the exception using DllImport, I've written the following rather buggy C++ code:
#include "pch.h"
#include "Violator.h"

void ViolateMe()
{
    int* data1 = 0;
    *data1 = 0;
}
Visual Studio 2019 even creates a warning when building the code:
6011: Dereferencing NULL pointer 'data1'.
To call this from C# I'm using the following code:
class Program
{
    static void Main(string[] args)
    {
        try
        {
            ViolateMe();
        }
        catch (AccessViolationException e)
        {
            Console.WriteLine(e);
        }
    }

    [DllImport(@"C:\path\to\ViolatorLib.dll")]
    private static extern int ViolateMe();
}
When running the code, the AccessViolationException is in fact thrown, but our catch blog is never hit. There are multiple ways of making sure that happens. One is to add the HandleProcessCorruptedStateExceptionsAttribute attribute to the method like this:
class Program
{
    [HandleProcessCorruptedStateExceptions]
    static void Main(string[] args)
    {
        ...
    }

    ...
}
Adding [HandleProcessCorruptedStateExceptions] to the Main method does cause the catch blog to actually catch the exception. Another approach is to set legacyCorruptedStateExceptionsPolicy to true in app/web.config:
<?xml version="1.0" encoding="utf-8" ?>
<configuration>
  ...
  <runtime>
    <legacyCorruptedStateExceptionsPolicy enabled="true"/>
  </runtime>
  ...
</configuration>
Microsoft seems to advise against adding that config, but I don't really agree. The reason they are doing it is that this is in fact a critical error, which probably results in an application being shut down. But you always want to tell your users that something bad happened and log the exception to your error log.
As for .NET Core, the HandleProcessCorruptedStateExceptionsAttribute class is in the framework, but it doesn't seem to cause AccessViolationException to be caught. I'm very interested in hearing people's experiences with this in .NET Core.
Debugging the error
To be honest, the AccessViolationException can be a nightmare to debug. In most cases, the error is produced from within unmanaged code that you won't have access to. Let's dive into different scenarios and discuss how to treat the exception in each case.
When you have access to the unmanaged code
Let's continue the example above. In this case, I do in fact have access to failing C++ code. If you step into the ValidateMe method using F11 you'll notice that Visual Studio just skips over the C++ code and goes directly to the catch block. This is caused by native code debugging being disabled as a default. To fix that, right-click the C# project, click Properties, and select the Debug tab. Below Debugger engines make sure to check the Enable native code debugging (or simply click CTRL+t). When the project is saved and the application is launched, Visual Studio now breaks inside the C++ code:
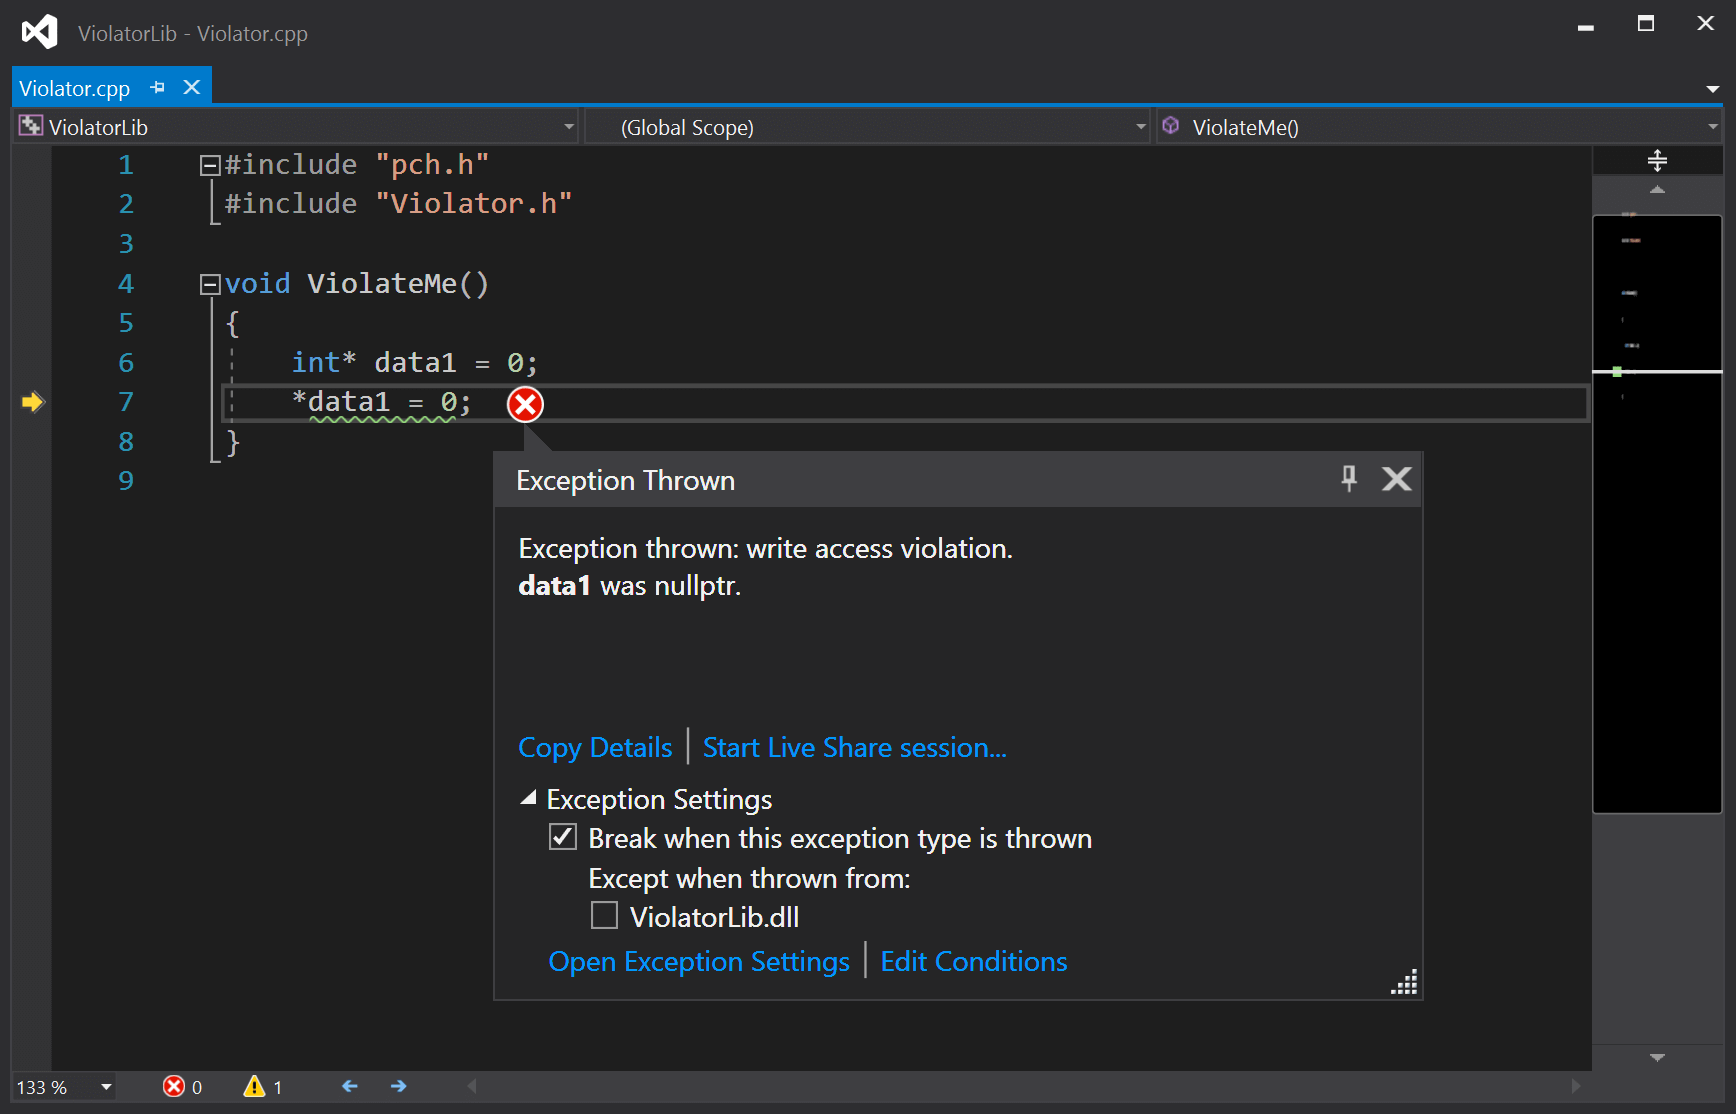
Being able to see the exact line and variable causing this error is a great help.
When you don't have access to the unmanaged code
Bugger. You kept reading because you don't have access to the failing code, right? In this case, there's not much else to do than to contact the maintainers of the code. To help them, you can produce a memory dump of the application. To do so, run the application through Visual Studio and wait until the exception occurs. Then click Debug | Save Dump As... and name the file. The developers of the unmanaged code can use tools like WinDbg to try and find out what is going on.
Now that I've already mentioned WinDbg, you might think "why don't you just check out what's wrong using WinDbg yourself?" Good question. That is definitely possible. WinDbg definitely saved me a time or two. Using WinDbg is pretty far from the skills required by the typical .NET developer, though. If there is a general demand for it, I'll write something up. For now, you just need to know it is possible to create process memory dumps using Visual Studio.
When using the WebBrowser control
Both Windows Forms and WPF comes with a bundled web browser component simply called WebBrowser. I've both experienced the AccessViolationException, as well as seen a lot of people complaining about the exception in this context.
The browser components were pretty buggy back in the days. In recent years, I believe most of the problems have been caused by threading issues. Web controls in C# are typically used to produce some kind of headless snapshot of an URL. I mean, how many Windows Forms applications with embedded browser capabilities are you producing these days?
When creating the WebBrowser control in a thread, make sure to set the correct ApartmentState on the thread:
var thread = new Thread(() =>
{
   var br = new WebBrowser();
   br.Navigate(url);
});
thread.SetApartmentState(ApartmentState.STA);
thread.Start();
The STA state is the only valid (to my knowledge) way to run ActiveX components like WebBrowser. As an alternative, you can still decorate a method invoked by the thread with the [STAThread] attribute.
AccessViolationException inside IIS
I haven't experienced this exception on IIS, but I've seen people asking about it. The typical solution here is to make sure you are running the newest version of .NET.
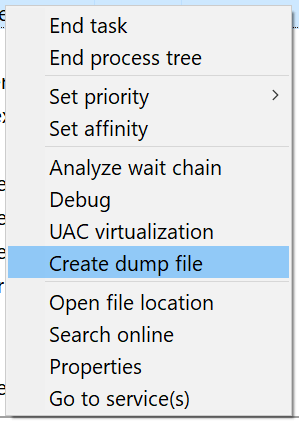
Like in the example with the web browser control, a memory dump can help debug this error if handed over to someone with knowledge about WinDbg and similar tools. In order to create a memory dump from a running IIS process, you will need to locate the w3wp.exe process in the Task Manager of the application pool running your application. When found, right-click the process and select the Create dump file menu item:
That was it! Unless heavily requested, this will be the last post about debugging common .NET exceptions. Check out the list of all the posts here: Debugging common .NET exceptions.
elmah.io: Error logging and Uptime Monitoring for your web apps
This blog post is brought to you by elmah.io. elmah.io is error logging, uptime monitoring, deployment tracking, and service heartbeats for your .NET and JavaScript applications. Stop relying on your users to notify you when something is wrong or dig through hundreds of megabytes of log files spread across servers. With elmah.io, we store all of your log messages, notify you through popular channels like email, Slack, and Microsoft Teams, and help you fix errors fast.

See how we can help you monitor your website for crashes Monitor your website