
12 practices for optimizing PostgreSQL queries for large datasets
A database is the root of most applications. Anything displayed or any operations performed often rely on the database. So, to build a loyal client base, you have to think in terms of a database. In today's post, I will go through some key strategies you can apply to optimize your PostgreSQL database and win the performance war.
Create indexes on frequently queried columns
Index data structures allow a row to be looked up quickly without scanning the entire table.
Without Indexes:
EXPLAIN ANALYZE
SELECT *
FROM orders
WHERE customer_id = 500;
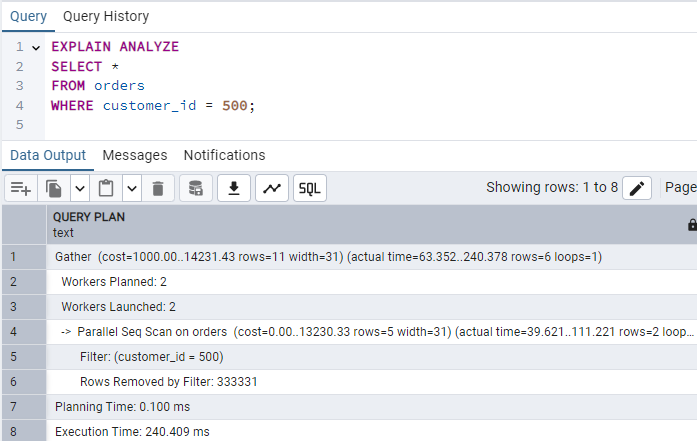
So, the execution time is 240 milliseconds.
After Index:
CREATE INDEX idx_orders_customer_id
ON orders(customer_id);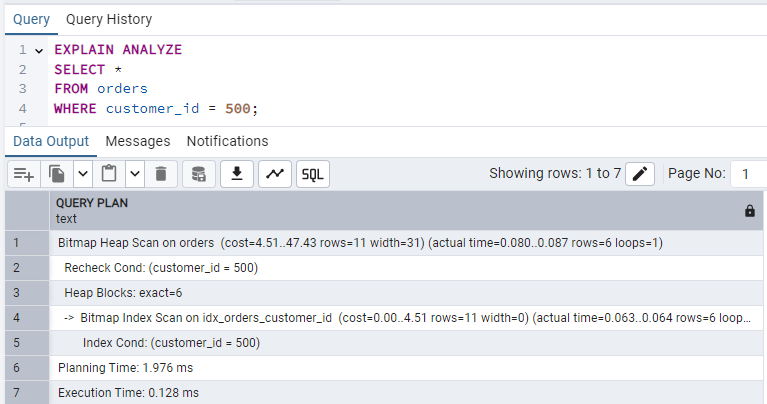
Normalize the database strategically
Normalization is a crucial step in database design to reduce anomalies and redundancy. Simply break your table into maintainable tables with logically coherent columns.
Instead of keeping role information in the user table, introduce a separate Role table and map it to User to keep data integral and non-redundant.
Keep in mind that over-normalization can also lead to performance penalties. Joining tables is more expensive than querying a single table, so you should analyze which columns should be split into new, normalized tables.
Avoid SELECT *
Fetch only the required columns from the query.
Bad query with SELECT *:
EXPLAIN ANALYZE
SELECT *
FROM orders
WHERE status = 'Completed';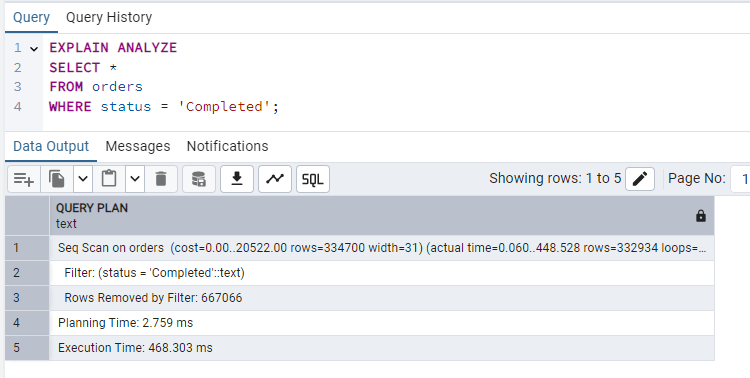
Now, with selective columns, let's say I only need id and amount, so I'm fetching only those columns:
EXPLAIN ANALYZE
SELECT id, amount
FROM orders
WHERE status = 'Completed';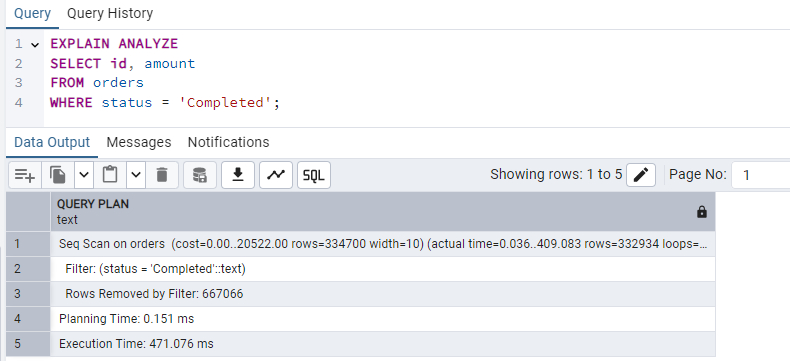
In this example, the execution time is identical, but it reduces I/O and memory usage, especially as the database schema becomes more complex. If the columns you select are all part of an index, PostgreSQL can return the data directly from the index without touching the heap (the actual table file). In that case, this can improve performance as well as I/O.
Order JOINs properly
Ordering JOINs properly can also affect performance. Modern PostgreSQL uses a cost-based optimizer. It analyzes table statistics to determine the most efficient join order and method regardless of the order you write them in the query. But when dealing with older versions or if settings like join_collapse_limit is set manually, this still applies.
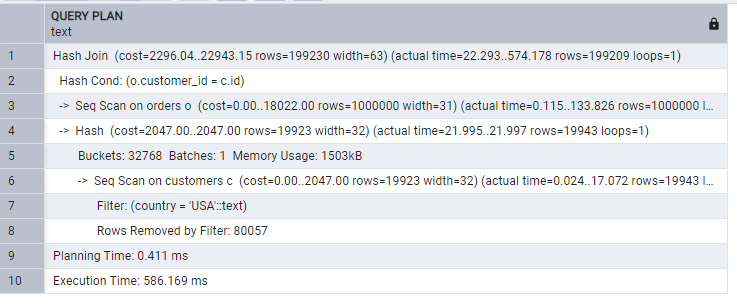
Consider this query:
EXPLAIN ANALYZE
SELECT *
FROM orders o
JOIN customers c
ON o.customer_id = c.id
WHERE c.country = 'USA';
Now calling the customers table before:
EXPLAIN ANALYZE
SELECT *
FROM customers c
JOIN orders o
ON c.id = o.customer_id
WHERE c.country = 'USA';
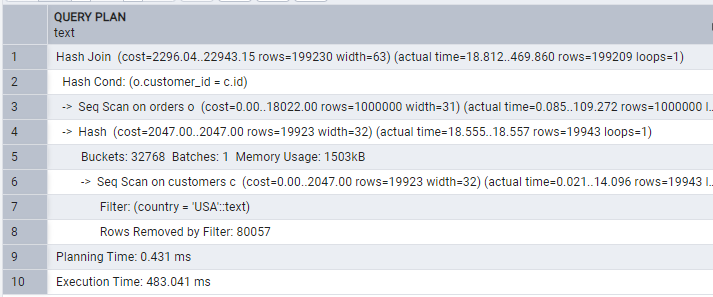
The orders table has 1 million rows, while the clusters have 100k. When we fetch orders before then, we have a larger set to JOIN with customers. If we use customers first, then join with orders, fewer rows are filtered in the first stage. Filtering earlier reduces the rows participating in the join.
Use LIMIT When Exploring Data
In most cases, you will not use thousands of data points at once. Usually, you fetch a chunk of data to display at once, which is practical for UI display. Using that information, only fetch the required amount of data:
EXPLAIN ANALYZE
SELECT *
FROM orders
ORDER BY created_at DESC;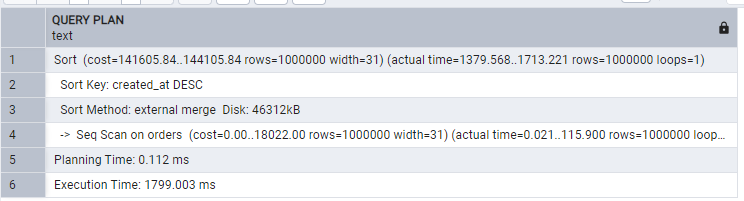
While the efficient way:
EXPLAIN ANALYZE
SELECT *
FROM orders
ORDER BY created_at DESC
LIMIT 50;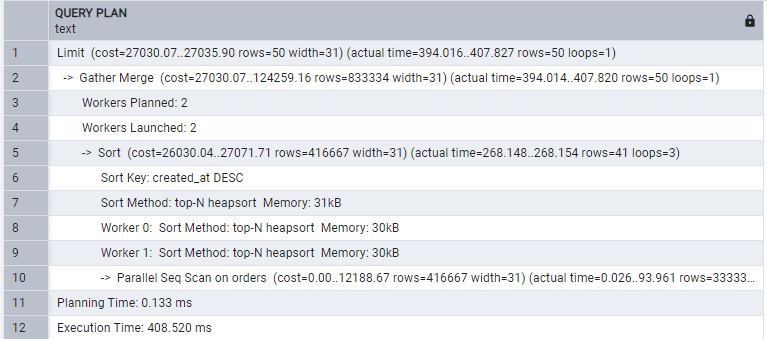
Hence, fetching limited rows saves you in all ways.
Use partial indexes
A naive way for the query would be:
EXPLAIN ANALYZE
SELECT *
FROM orders
WHERE status = 'Completed';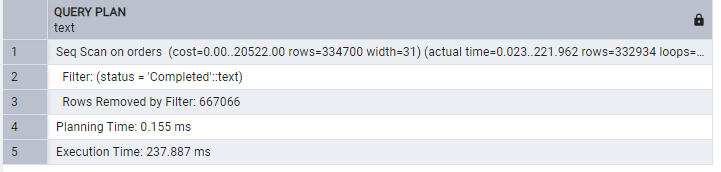
Creating a partial index:
CREATE INDEX idx_completed_orders
ON orders(customer_id)
WHERE status = 'Completed';
Now the same query gives:
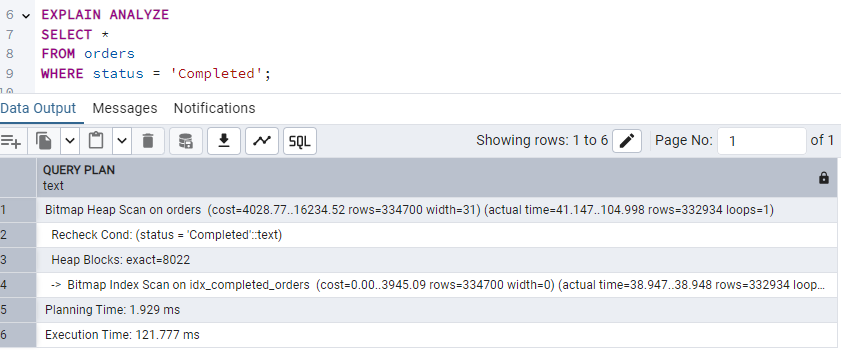
Hence, indexing reduced the execution time to half that of the prior query. Simply create an index for frequently filtered values to speed up.
Use Proper Data Types
Each data type has its own storage size and comparison time. Columns like primary keys should be handled with care due to these differences. Ints are faster than text, so use int as the primary key column for faster comparisons.
Good advice is to use the smallest sufficient data type. For example, use bigint instead of int if you expect more than 2.1 billion rows, as changing a PK type later is a high-risk operation.
Avoid Functions on Indexed Columns
Functions on indexed columns prevent index usage:
EXPLAIN ANALYZE
SELECT *
FROM customers
WHERE LOWER(name) = 'customer 100';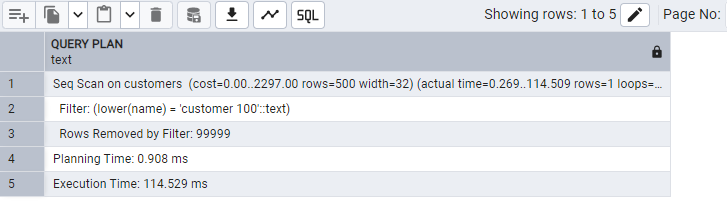
Creating an index :
CREATE INDEX idx_customers_lower_name
ON customers(LOWER(name));
Now, the same query gives:
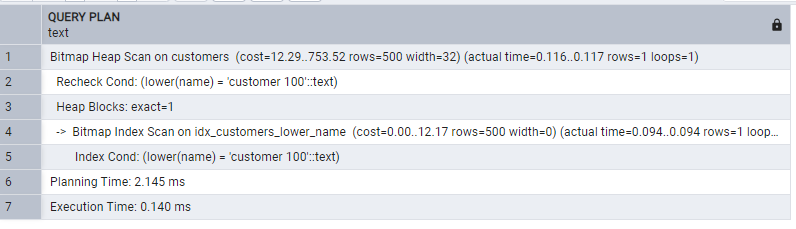
We included the function in the index. Index can now support the function.
Partition large tables
Partitioning is another healthy way to handle large data sets. It divides a table into smaller ones:
EXPLAIN ANALYZE
SELECT *
FROM orders
WHERE created_at BETWEEN '2025-01-01' AND '2025-06-30';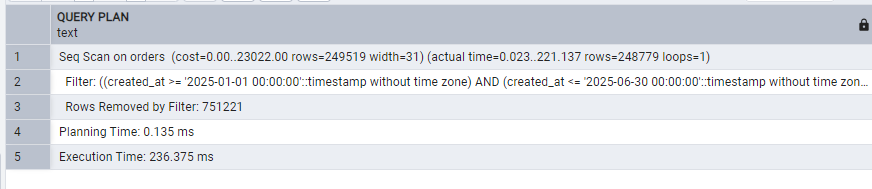
Create a copy table where we will use partitioning:
CREATE TABLE public.orders_partitioned(
    id          serial NOT NULL ,
    customer_id integer,
    amount      numeric,
    status      text,
    created_at  timestamp without time zone NOT NULL,
    CONSTRAINT orders_partitioned_pkey PRIMARY KEY (id, created_at)
) PARTITION BY RANGE (created_at);
Create yearly partitions:
CREATE TABLE public.orders_2024
    PARTITION OF public.orders_partitioned
    FOR VALUES FROM ('2024-01-01') TO ('2025-01-01');

CREATE TABLE public.orders_2025
    PARTITION OF public.orders_partitioned
    FOR VALUES FROM ('2025-01-01') TO ('2026-01-01');

CREATE TABLE public.orders_2026
    PARTITION OF public.orders_partitioned
    FOR VALUES FROM ('2026-01-01') TO ('2027-01-01');

-- Default partition — catches ANY row that doesn't fit the ranges above
CREATE TABLE public.orders_default
    PARTITION OF public.orders_partitioned
    DEFAULT;
Copy the data into our partitioned table:
INSERT INTO public.orders_partitioned SELECT * FROM public.orders;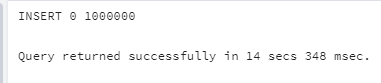
Just to check if everything is well:
SELECT
    inhrelid::regclass AS partition
FROM pg_inherits
WHERE inhparent = 'orders_partitioned'::regclass;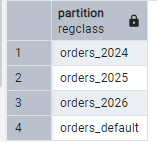
We can see 4 partitions created. Now the same query after partition:
EXPLAIN ANALYZE
SELECT *
FROM orders_partitioned
WHERE created_at BETWEEN '2025-01-01' AND '2025-06-30';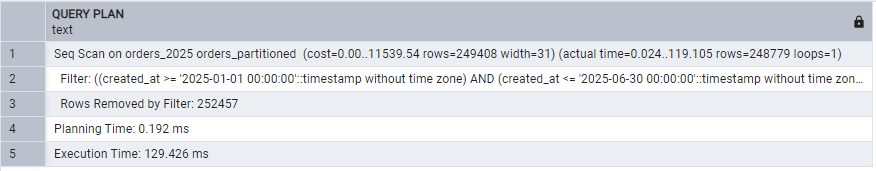
Use a transaction for bulk operations.
Operations like inserting or updating multiple rows at once use transactions. Transaction groups multiple SQL operations into a single unit of work. Instead of committing after every statement, PostgreSQL commits only once at the end of the transaction:
INSERT INTO orders(customer_id, amount, status)
VALUES (1,100,'Completed');

INSERT INTO orders(customer_id, amount, status)
VALUES (2,200,'Completed');

INSERT INTO orders(customer_id, amount, status)
VALUES (3,300,'Completed');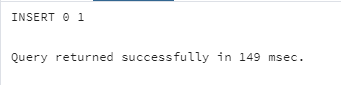
The above one writes each row one by one. Each insertion triggers a WAL write, a disk sync, and a commit operation:
BEGIN;

INSERT INTO orders(customer_id, amount, status)
VALUES (1,100,'Completed');

INSERT INTO orders(customer_id, amount, status)
VALUES (2,200,'Completed');

INSERT INTO orders(customer_id, amount, status)
VALUES (3,300,'Completed');

COMMIT;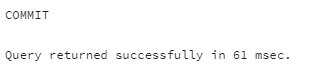
The transaction was completed in less than half the time. That is the only difference, with only 3 inserts. Once you scale up to more rows, this difference becomes more pronounced. transaction commits only once, awakening the expensive operations once for all the rows.
Avoid Long-Running Transactions
Long-running transactions keep old row versions alive underp PostgreSQL's MVCC. This prevents VACUUM from cleaning dead rows, causing table bloat:
BEGIN;

SELECT *
FROM orders;

COMMIT;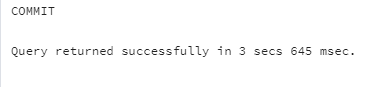
BEGIN;

UPDATE orders
SET status = 'Completed'
WHERE id = 100;

COMMIT;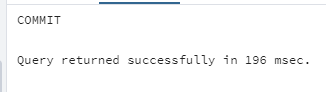
Short, focused transactions don't last as long as the first one in our example did. Besides, VACUUM can reclaim space and shorter transactions lower lock contention.
Clean the table and index bloats
Postgres table bloat occurs when a table contains dead rows that are no longer visible to any transaction but still occupy disk space. Postgres DELETE or UPDATE Operations create dead rows in the tables they modify. For example, if we run the following on an order row with a 400 amount:
UPDATE orders
SET amount = 1000
WHERE id = 55;
Postgres keeps the older row but marks it as dead, and adds a new one. That means the deleted row will be there along with the new one. Such dead rows pile up, overwhelming the storage. PostgreSQL provides VACUUM to reclaim or reuse the storage.
Index bloat occurs when indexes contain references to dead rows that still occupy space. Every update also updates indexes, so PostgreSQL keeps dead row indexes.
Bloated tables and indexes can significantly slow down queries and unnecessarily consume additional disk space, pressuring I/O.
We can simply fix table bloat manually:
VACUUM orders;This reclaims storage occupied by dead rows and ensures that the space can be reused:
VACUUM FULL orders;The above is an intensive counterpart that reclaims all storage occupied by dead rows, including the space at the end of the table. Be aware that a full vacuum will block all reads and writes to that table until it finishes. For large datasets, this can cause hours of downtime.
Usually, an AUTOVACUUM is by default enabled, which we can check
SHOW autovacuum;
You can configure the auto vacuum. Make sure it remains on, otherwise, leaving dead rows can eat up space, which is dangerous for the production database. You can simply do it by running:
ALTER SYSTEM SET autovacuum = 'on';
SELECT pg_reload_conf();
How often should it run:
-- Set the naptime to 30 seconds for more aggressive cleanup
ALTER SYSTEM SET autovacuum_naptime = '30s';
-- Reload the configuration to apply changes without restarting the service
SELECT pg_reload_conf();
When vacuum triggers:
autovacuum_vacuum_threshold = 50
autovacuum_vacuum_scale_factor = 0.2
The above configuration means running the vacuum when the number of dead rows exceeds 50 and when 20% of the table size is reached.
Apply changes by running:
SELECT pg_reload_conf();For a table level:
ALTER TABLE orders
SET (
    autovacuum_vacuum_threshold = 50
    autovacuum_vacuum_scale_factor = 0.2
);
To view how much storage your tables are taking, run:
SELECT
    relname,
    pg_size_pretty(pg_total_relation_size(relid)) AS total_size
FROM pg_catalog.pg_statio_user_tables
ORDER BY pg_total_relation_size(relid) DESC;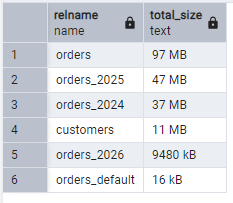
Conclusion
As a popular database choice for scalable applications, PostgreSQL requires several performance optimization techniques to keep the system fast. In this post, I presented the 12 most insightful ways to speed up your database. From indexing and partitioning to projection and handling bloat. I shared them in detail and explained how to implement them.
elmah.io: Error logging and Uptime Monitoring for your web apps
This blog post is brought to you by elmah.io. elmah.io is error logging, uptime monitoring, deployment tracking, and service heartbeats for your .NET and JavaScript applications. Stop relying on your users to notify you when something is wrong or dig through hundreds of megabytes of log files spread across servers. With elmah.io, we store all of your log messages, notify you through popular channels like email, Slack, and Microsoft Teams, and help you fix errors fast.

See how we can help you monitor your website for crashes Monitor your website