"Secret" elmah.io features #1 - Include source code in errors
This is a new series of blog posts that I have been wanting to write for a while. elmah.io offers a large range of features both through the UI and the list of integrations. While basic error monitoring is used by all of our users, there are features available that can provide huge value but are not so commonly used or known. In this first part, I'll go through including source code in errors and how it will make it easier to debug errors.

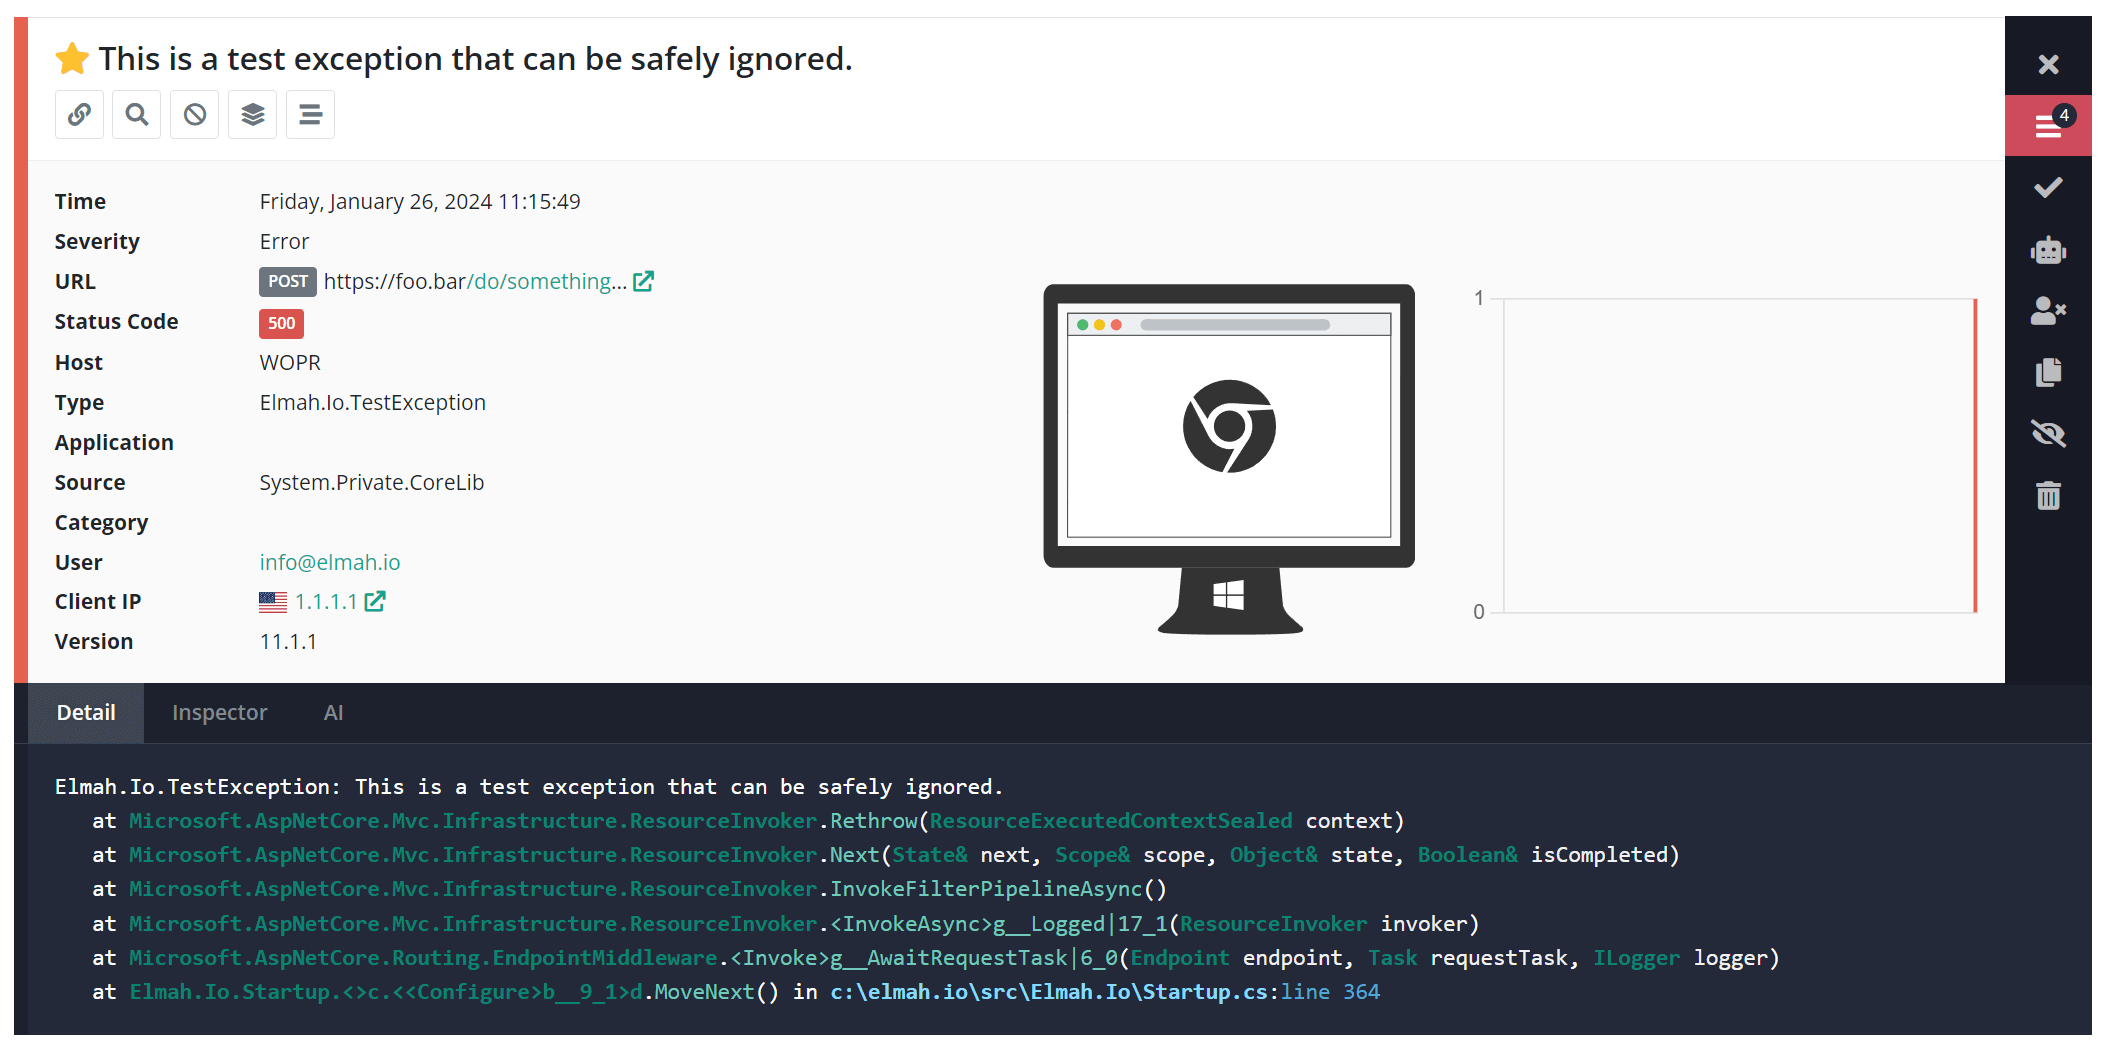
If you are an existing user of elmah.io or if you've ever looked at log messages in similar systems, you have seen a stack trace like this:

This example shows a test error with a range of information embedded in the stack trace. Sometimes, it is possible to figure out what went wrong by looking at the stack trace alone, but often, you'd need to look inside the code causing the exception. In the example above, the error is caused by line 364 in the Startup.cs file. This will require you to do several things before being able to inspect the content of the Startup.cs file:
- You need to know which project/solution that includes this file.
- You may need to clone the code or find the repository through a browser.
- You need to open the solution.
- You need to open the
Program.csfile. - You need to navigate to line
364.
Luckily, there's a way to fix that when using elmah.io, and the real subject of this post: Including source code in errors. Source code inclusion will automatically pick up a piece of the source file when errors are logged. It's made as an extension to the Elmah.Io.Client package (that's the package that all of our client integrations are built on top of). The extension works with all integrations, so I'll use ASP.NET Core as an example for the rest of this post. Start by installing the Elmah.Io.Client.Extensions.SourceCode package:
dotnet add package Elmah.Io.Client.Extensions.SourceCode
Next, implement the OnMessage action which is a callback made by Elmah.Io.AspNetCore before logging a message to elmah.io:
builder.Services.AddElmahIo(options =>
{
    // ...
    options.OnMessage = msg =>
    {
        // TODO
    };
});
Source code can be included in two ways:
- Through files on the file system.
- Through embedded sources in the
.pdffile.
You typically don't have the source files available on the file system when running on production, why pulling the source from the .pdb file is the more obvious choice. To include the source code in the .pdb file you need to extend your .csproj files with the following property:
<PropertyGroup>
  <EmbedAllSources>true</EmbedAllSources>
</PropertyGroup>
With source files embedded, we can go ahead and implement the OnMessage action:
options.OnMessage = msg =>
{
    msg.WithSourceCodeFromPdb();
};
The WithSourceCodeFromPdb method will parse the logged stack trace and try to find the source code causing the error. The stack trace in elmah.io now includes the filename as a link and a new Source code tab:

When clicking either the link or the tab header, you will see the source code embedded with this error:

Inspecting the line causing an error is now dead easy and doesn't require you to even have the code cloned locally. To learn more about including source code in errors, check out the documentation. Also, I know that embedding source code in the .pdb file can be a bit of a controversial subject. Make sure to discuss internally if you want your source code published this way.
While you are at it, why not check out the next post: "Secret" elmah.io features #2 - Correlate messages from apps.
elmah.io: Error logging and Uptime Monitoring for your web apps
This blog post is brought to you by elmah.io. elmah.io is error logging, uptime monitoring, deployment tracking, and service heartbeats for your .NET and JavaScript applications. Stop relying on your users to notify you when something is wrong or dig through hundreds of megabytes of log files spread across servers. With elmah.io, we store all of your log messages, notify you through popular channels like email, Slack, and Microsoft Teams, and help you fix errors fast.
See how we can help you monitor your website for crashes Monitor your website
