"Secret" elmah.io features #2 - Correlate messages from apps
This is the second post in the series about "secret" elmah.io features. While reading the first post before this one is not required, I highly recommend you also check it out. In this post, I'll introduce you to the correlation features available in elmah.io.
Before digging into the code let's talk about correlations, what it is, and why it is needed. While some systems are implemented as monoliths, more modern development, deployment, and hosting practices emerged over the last years. You are probably already familiar with the term "Microservices" which seems to have been the subject of discussion for quite some time now. This post is not an advocate for using monoliths, microservices, or anything in between. The main takeaway here is that most systems consist of a minimum of two processes: a client and a server. Many, contain more processes where async handling is moved behind a queue, Windows services, Azure Functions, etc.
When logging from multiple processes, it can be hard to track an entire transaction spanning multiple threads, processes, and even machines. Say hello to correlations. With a correlation ID on each log message, you will be able to correlate messages across multiple sources into a single view. Getting the complete picture will make it easier to track down an error. Consider a view telling you that:
- An API client is making a request.
- An API is receiving a request.
- The API is publishing a message on a bus.
- A message bus consumer is receiving the message.
- A
NullReferenceExceptionhappened during the processing of the message.
Without a way to bundle log messages together, it can be hard to track down the API request originally causing the error.
Let's jump into code. In the following example, I will show how correlations can be set up in ASP.NET Core. All of our packages support correlations so pick whatever integration you prefer. When setting up an ASP.NET Core API to log to elmah.io you typically install both the Elmah.Io.AspNetCore and Elmah.Io.Extensions.Logging packages. The first package will log all uncaught exceptions to elmah.io, while the second will store all of the messages logged internally in ASP.NET Core as well as manually using the ILogger interface in elmah.io. The packages can be configured like this in the Program.cs file:
// I made up a random API key and log ID

var apiKey = "169f4bf9-be9f-4d1a-9390-38274e084965";
var logId = new Guid("4ae3ae7a-c27d-4192-a6b2-d0292e2d7099");

// Setup up Elmah.Io.Extensions.Logging

builder.Logging.AddElmahIo(options =>
{
    options.ApiKey = apiKey;
    options.LogId = logId;
    options.Application = "Microsoft.Extensions.Logging";
});

// Setup up Elmah.Io.AspNetCore

builder.Services.AddElmahIo(options =>
{
    options.ApiKey = apiKey;
    options.LogId = logId;
    options.Application = "ASP.NET Core";
});

// ...

app.UseElmahIo();
The two calls to AddElmahIo will set up the packages. I also added an application name to each integration for easier recognition later on.
Let's simulate an error by adding a bit of logging and an exception in Index.cshtml.cs. I'm using the default Razor Pages template here it but could be MVC, Minimal API, or what you prefer.
public class IndexModel : PageModel
{
    private readonly ILogger<IndexModel> _logger;

    public IndexModel(ILogger<IndexModel> logger)
    {
        _logger = logger;
    }

    public void OnGet()
    {
        _logger.LogWarning("This is a warning message");
        throw new ApplicationException();
    }
}
The endpoint will log a warning to elmah.io and throw an exception. If looking in elmah.io you will see three log messages:
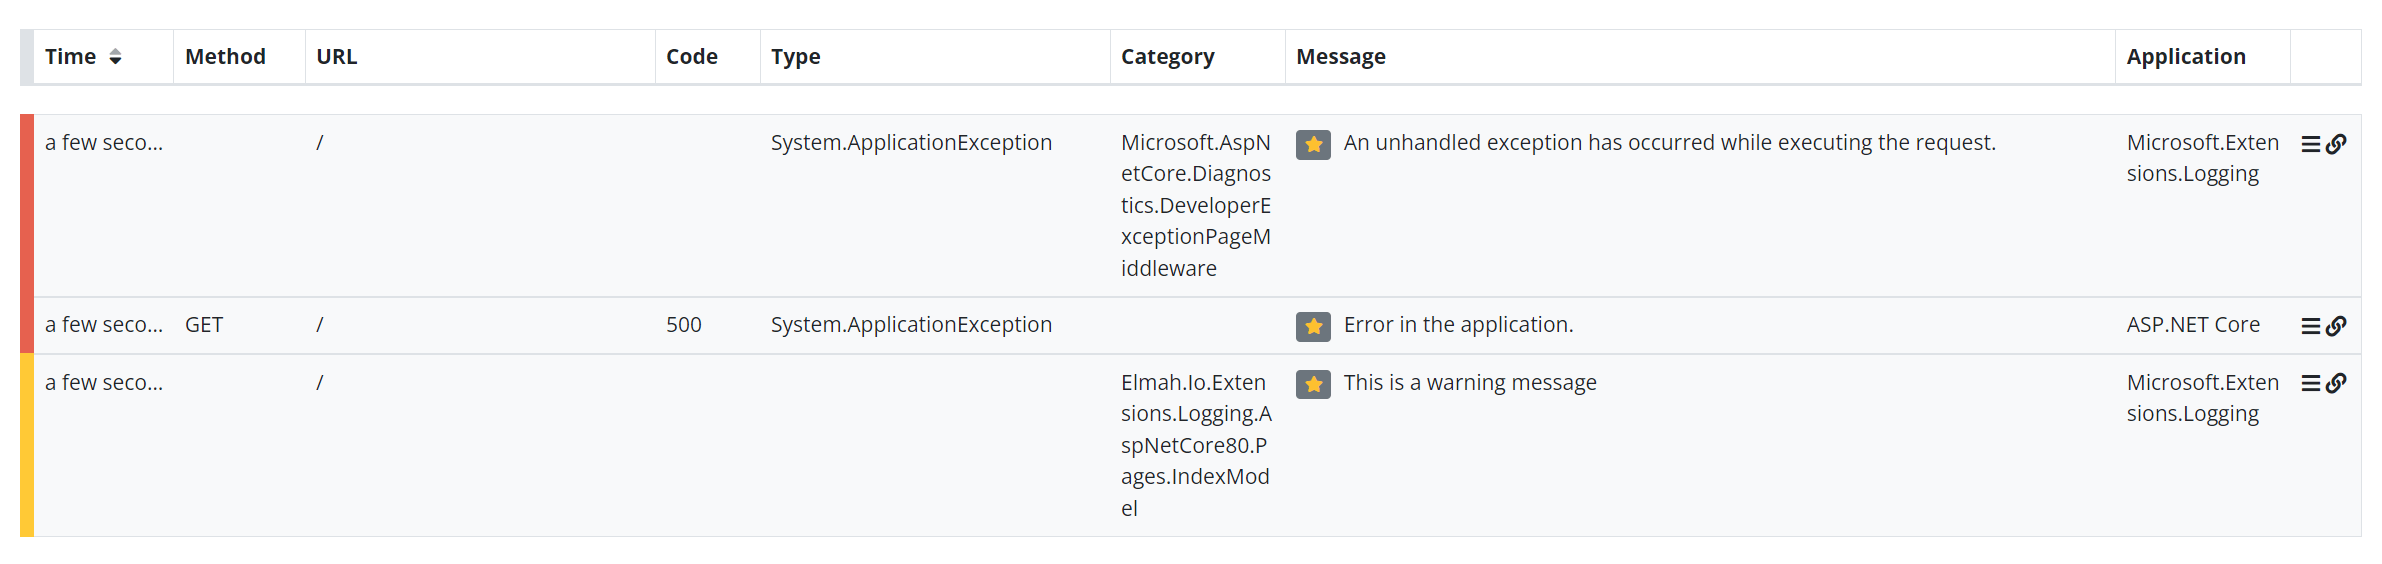
Starting from the bottom (the oldest) you see the warning that I logged manually through the ILogger interface. The following error (the middle one) is the error automatically logged by the Elmah.Io.AspNetCore package. And finally, the top (newest) error is logged from within the developer exception page middleware also through ILogger.
Looking at these three messages in isolation, it is easy to see that they probably belong together, based on the URL and timestamp. But consider a log with thousands of simultaneous log statements. To bundle these messages together, we have developed a special package named Elmah.Io.Client.Extensions.Correlation. After installing it, we can extend the configuration a bit:
// I made up a random API key and log ID

var apiKey = "169f4bf9-be9f-4d1a-9390-38274e084965";
var logId = new Guid("4ae3ae7a-c27d-4192-a6b2-d0292e2d7099");

// Setup up Elmah.Io.Extensions.Logging

builder.Logging.AddElmahIo(options =>
{
    options.ApiKey = apiKey;
    options.LogId = logId;
    options.Application = "Microsoft.Extensions.Logging";
    options.OnMessage = msg => msg.WithCorrelationIdFromActivity(); // ⬅️
});

// Setup up Elmah.Io.AspNetCore

builder.Services.AddElmahIo(options =>
{
    options.ApiKey = apiKey;
    options.LogId = logId;
    options.Application = "ASP.NET Core";
    options.OnMessage = msg => msg.WithCorrelationIdFromActivity(); // ⬅️
});

// ...

app.UseElmahIo();
I have marked the two added lines in the code but it's a simple implementation of the OnMessage event called by all elmah.io integrations before logging messages to elmah.io:
options.OnMessage = msg => msg.WithCorrelationIdFromActivity();
The line will put a value in the CorrelationId property on all log messages based on the current activity. An Activity is part of the W3C Trace Context specification, used to implement distributed tracing across multiple processes already adopted in ASP.NET Core.
Let's run the code again and inspect the log messages in elmah.io:
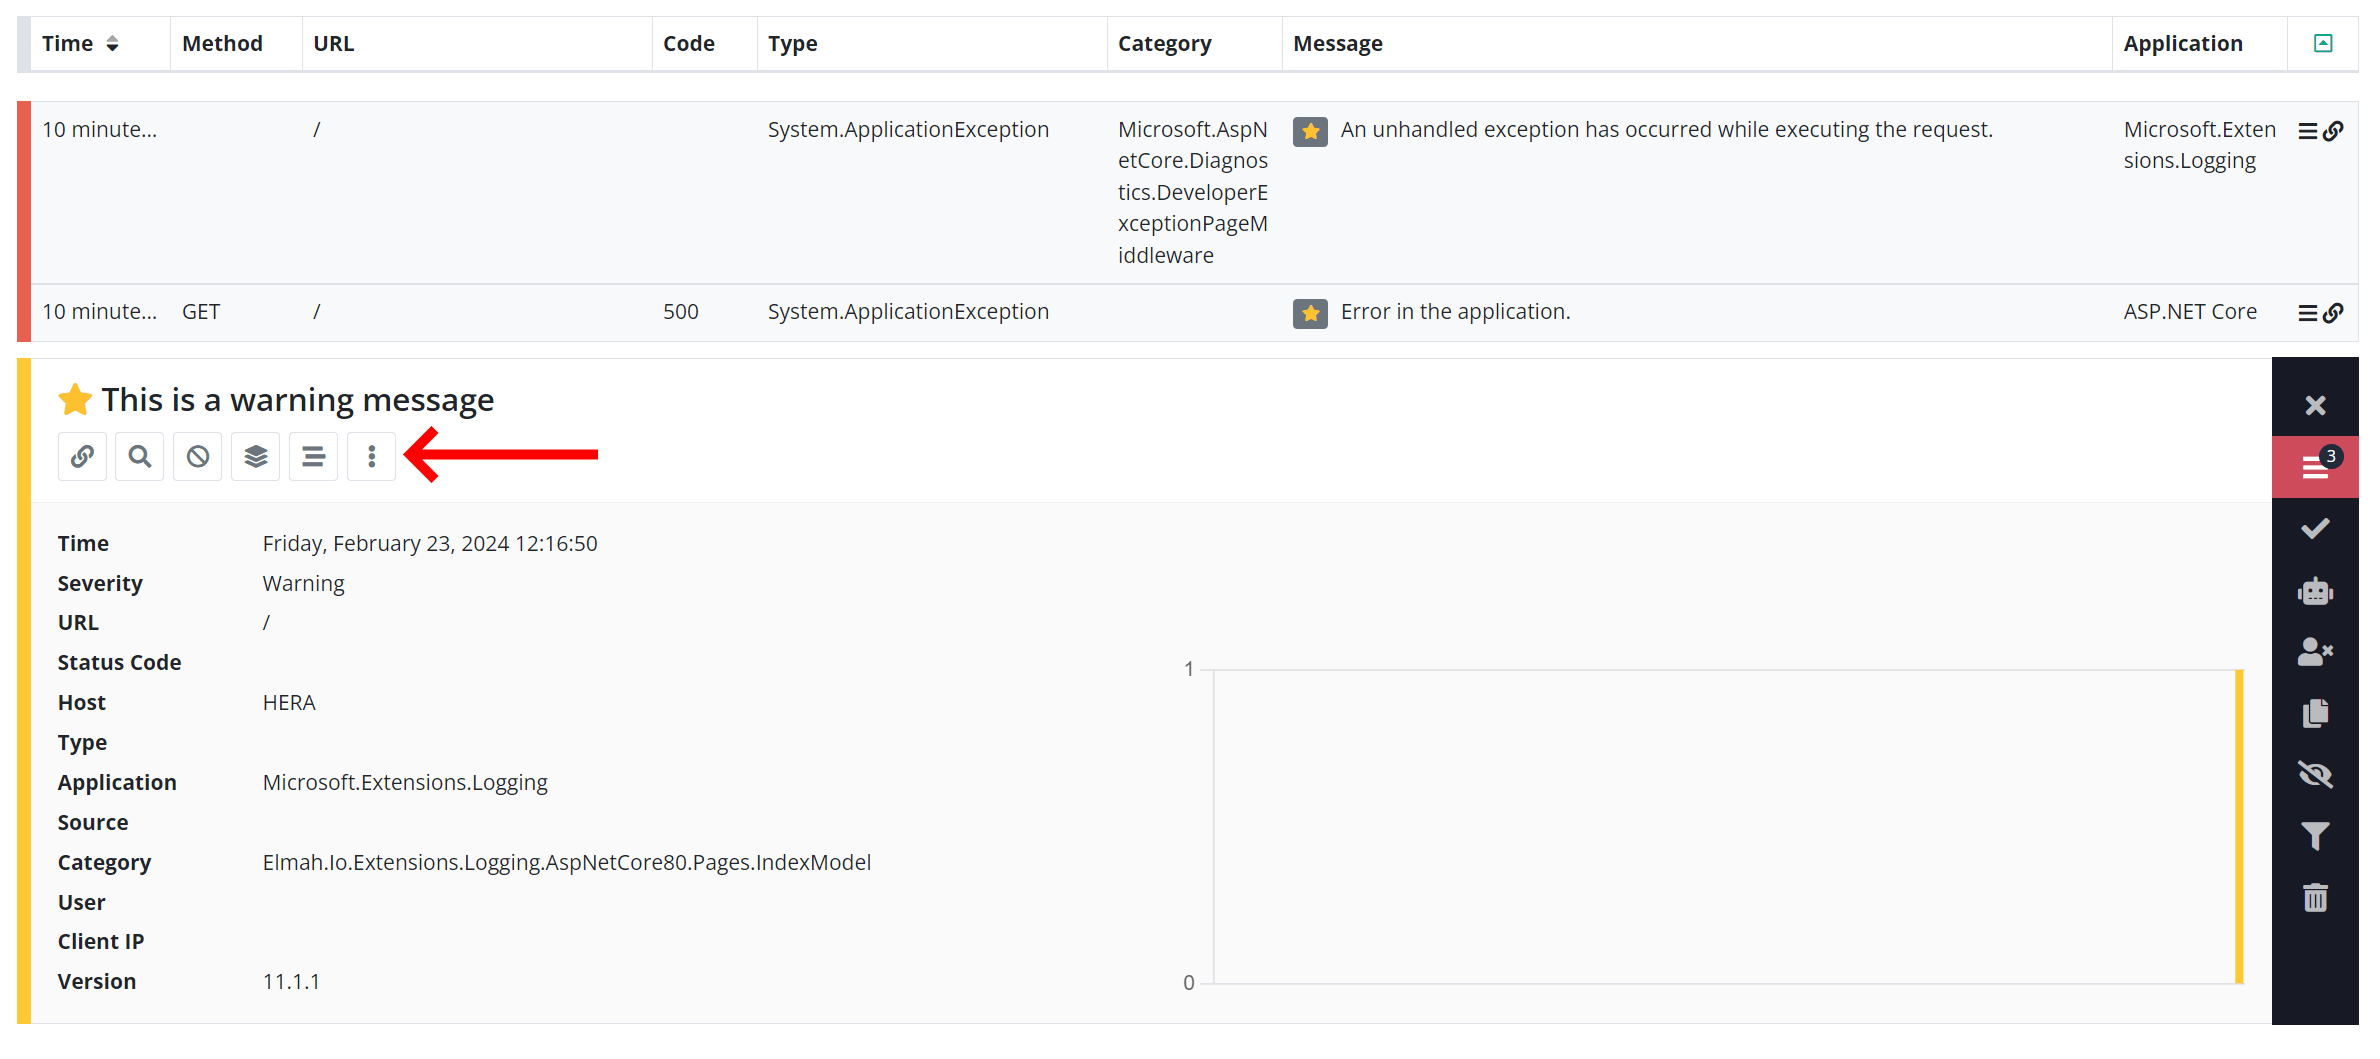
Notice the button with the three dots inside the expanded warning? This is an indication that this warning is part of a correlation or batch of messages. Clicking the button will show all of the messages in this correlation:
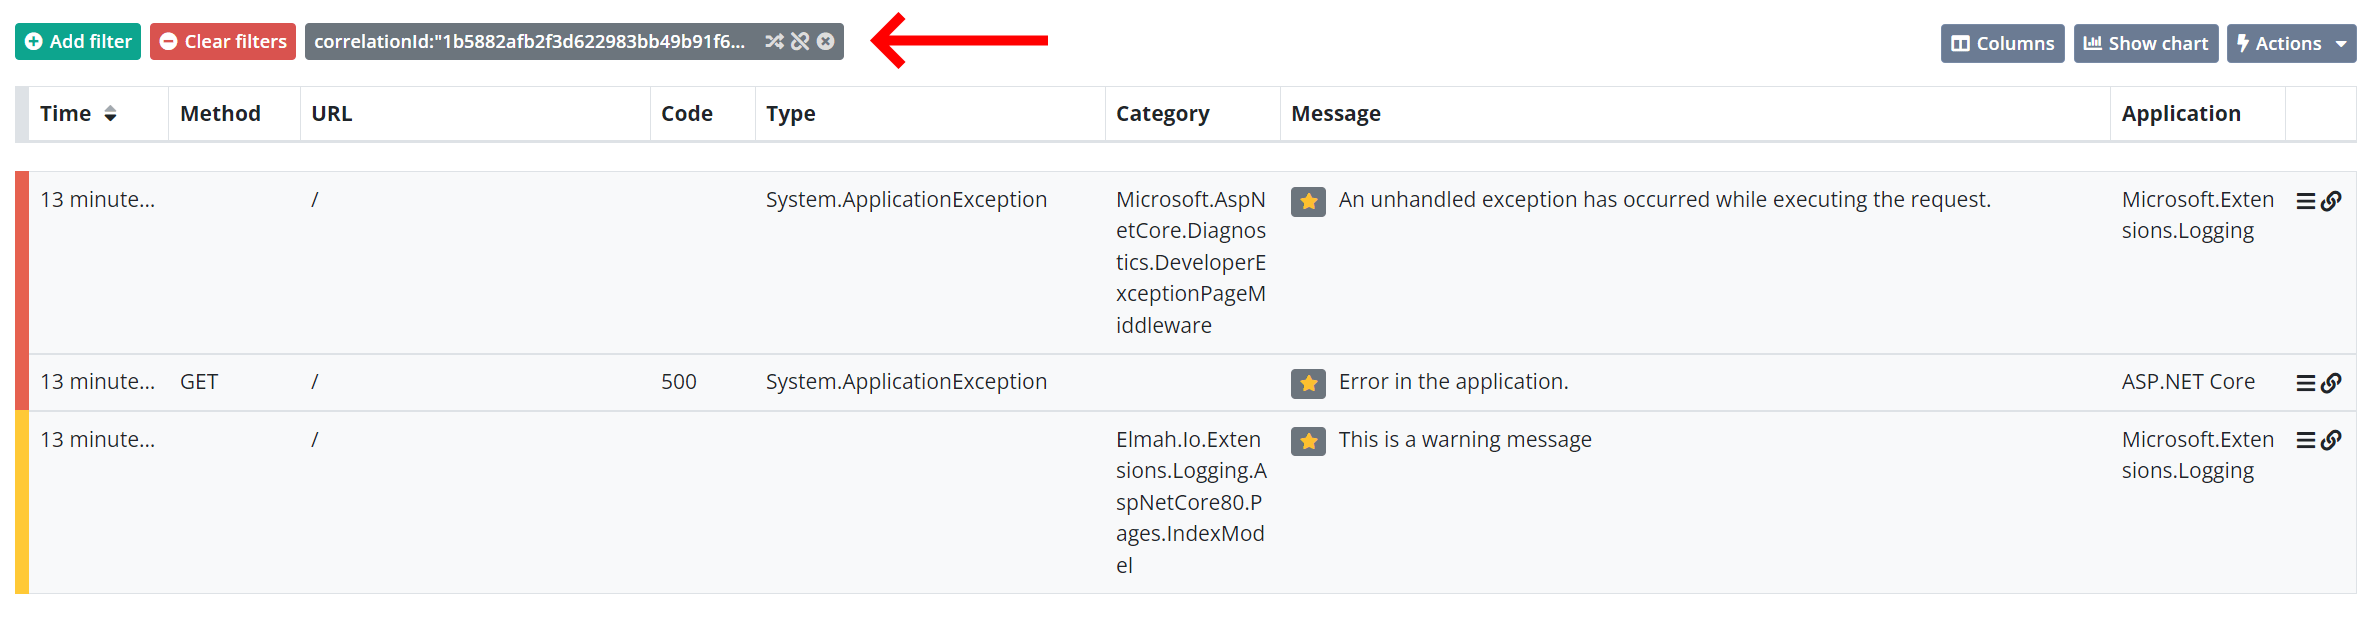
All of the log messages in this view now represent a single HTTP request, making it possible to easily trace one request at a time.
Until now, all of the log messages have been stored from within the same application process. So, while it is easy to correlate requests, I already promised you that this works across multiple processes and machines. Let's build a small API client invoking the endpoint and run it in another process:
var services = new ServiceCollection();
services.AddLogging(logging => logging.AddElmahIo(options =>
{
    options.ApiKey = "169f4bf9-be9f-4d1a-9390-38274e084965";
    options.LogId = new Guid("4ae3ae7a-c27d-4192-a6b2-d0292e2d7099");
    options.Application = "ApiClient";

}).AddFilter<ElmahIoLoggerProvider>(null, LogLevel.Information));

using (var serviceProvider = services.BuildServiceProvider())
{
    var loggerFactory = serviceProvider.GetService<ILoggerFactory>();
    var logger = loggerFactory.CreateLogger("ApiClient");

    var httpClient = new HttpClient();

    try
    {
        logger.LogInformation("Fetching data from the API");
        var result = await httpClient.GetStreamAsync("https://localhost:7282/");
    }
    catch (Exception e)
    {
        logger.LogError(e, "Error during request");
    }
}
This is a simple console application setting up the Elmah.Io.Extensions.Logging integration and calling the endpoint from previously using the HttpClient class. In real code, you'd need better initialization of the HttpClient but let's keep that part of for simplicity.
If we were to run this code without any modifications, the Fetching data from the API and Error during request messages would be logged to elmah.io but without a correlation ID. As in the config code for ASP.NET Core, we need the Elmah.Io.Client.Extensions.Correlation package installed and configured using:
options.OnMessage = msg => msg.WithCorrelationIdFromActivity();
Unlike ASP.NET Core, the HttpClient doesn't automatically set up an activity on new requests. To do so, we need to wrap our requests in code available in the System.Diagnostics namespace:
var activity = new Activity("ApiCall").Start(); // ⬅️

try
{
    logger.LogInformation("Fetching data from the API");
    var result = await httpClient.GetStreamAsync("https://localhost:7282/");
}
catch (Exception e)
{
    logger.LogError(e, "Error during request");
}
finally              // ⬅️
{                    // ⬅️
    activity.Stop(); // ⬅️
}                    // ⬅️
The new lines have been marked with an arrow. Before creating the request I create a new Activity and give it a name. Next, I call the Start method and make the request. Finally, I call the Stop method indicating that the activity is over. The HTTP client will now automatically enrich the HTTP request with additional headers about the activity for ASP.NET Core to pick up.
Now we are ready to run the code which as expected puts the same correlation ID on all five messages, logged across two different processes:
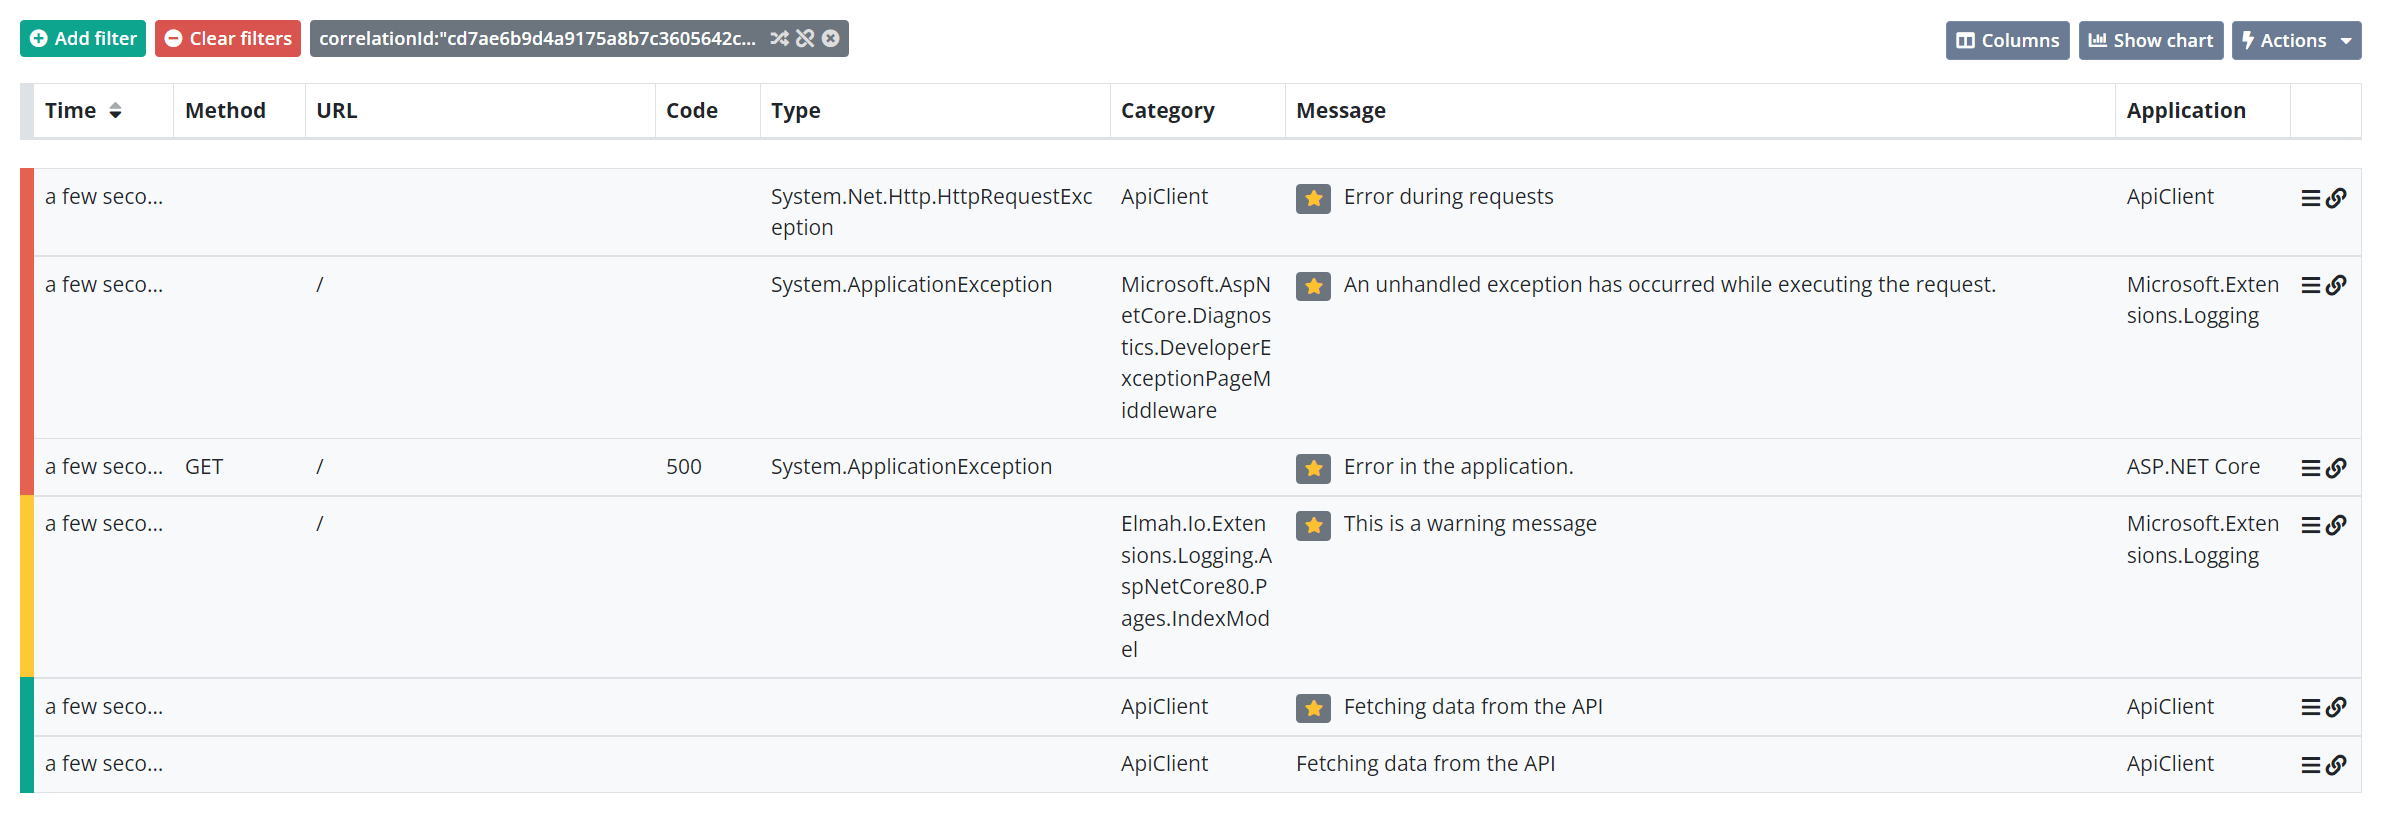
I hope this introduction has inspired you to set up correlations on your own log messages. While I know that most of you are using separate logs for the different applications, doing something simple as correlating messages between ASP.NET Core and the logging framework in use can still make a huge difference.
elmah.io: Error logging and Uptime Monitoring for your web apps
This blog post is brought to you by elmah.io. elmah.io is error logging, uptime monitoring, deployment tracking, and service heartbeats for your .NET and JavaScript applications. Stop relying on your users to notify you when something is wrong or dig through hundreds of megabytes of log files spread across servers. With elmah.io, we store all of your log messages, notify you through popular channels like email, Slack, and Microsoft Teams, and help you fix errors fast.

See how we can help you monitor your website for crashes Monitor your website