
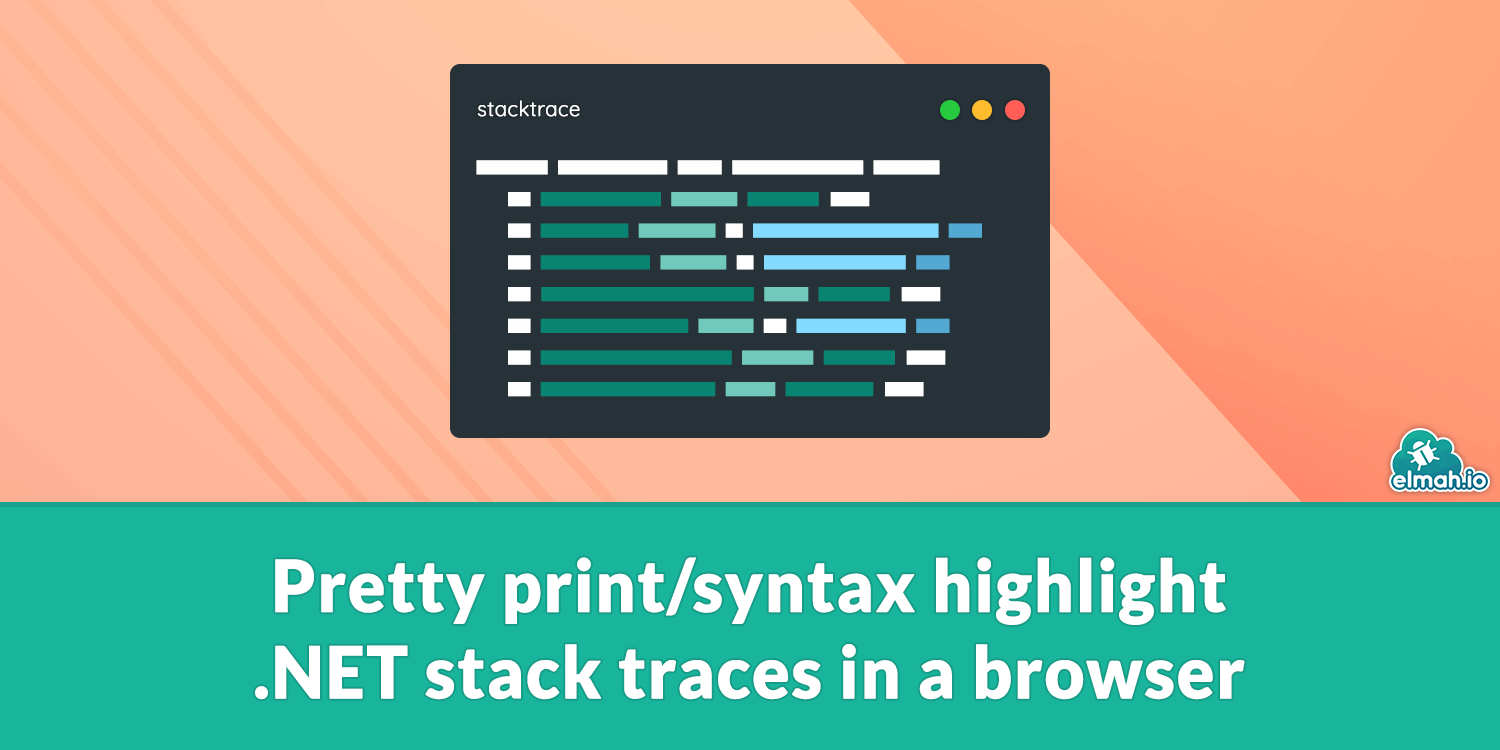
Pretty print/syntax highlight .NET stack traces in a browser ✨
Being a perfectionist like me, I cannot help notice every time someone publishes an either unformatted or non-highlighted .NET stack trace online. I mean, StackOverflow is filled with these things. I have built this online Stack Trace Formatter to help. But what if you want to print stack traces on your website? In this post, I'll show you how to pretty print and syntax highlight .NET stack traces directly in the browser.
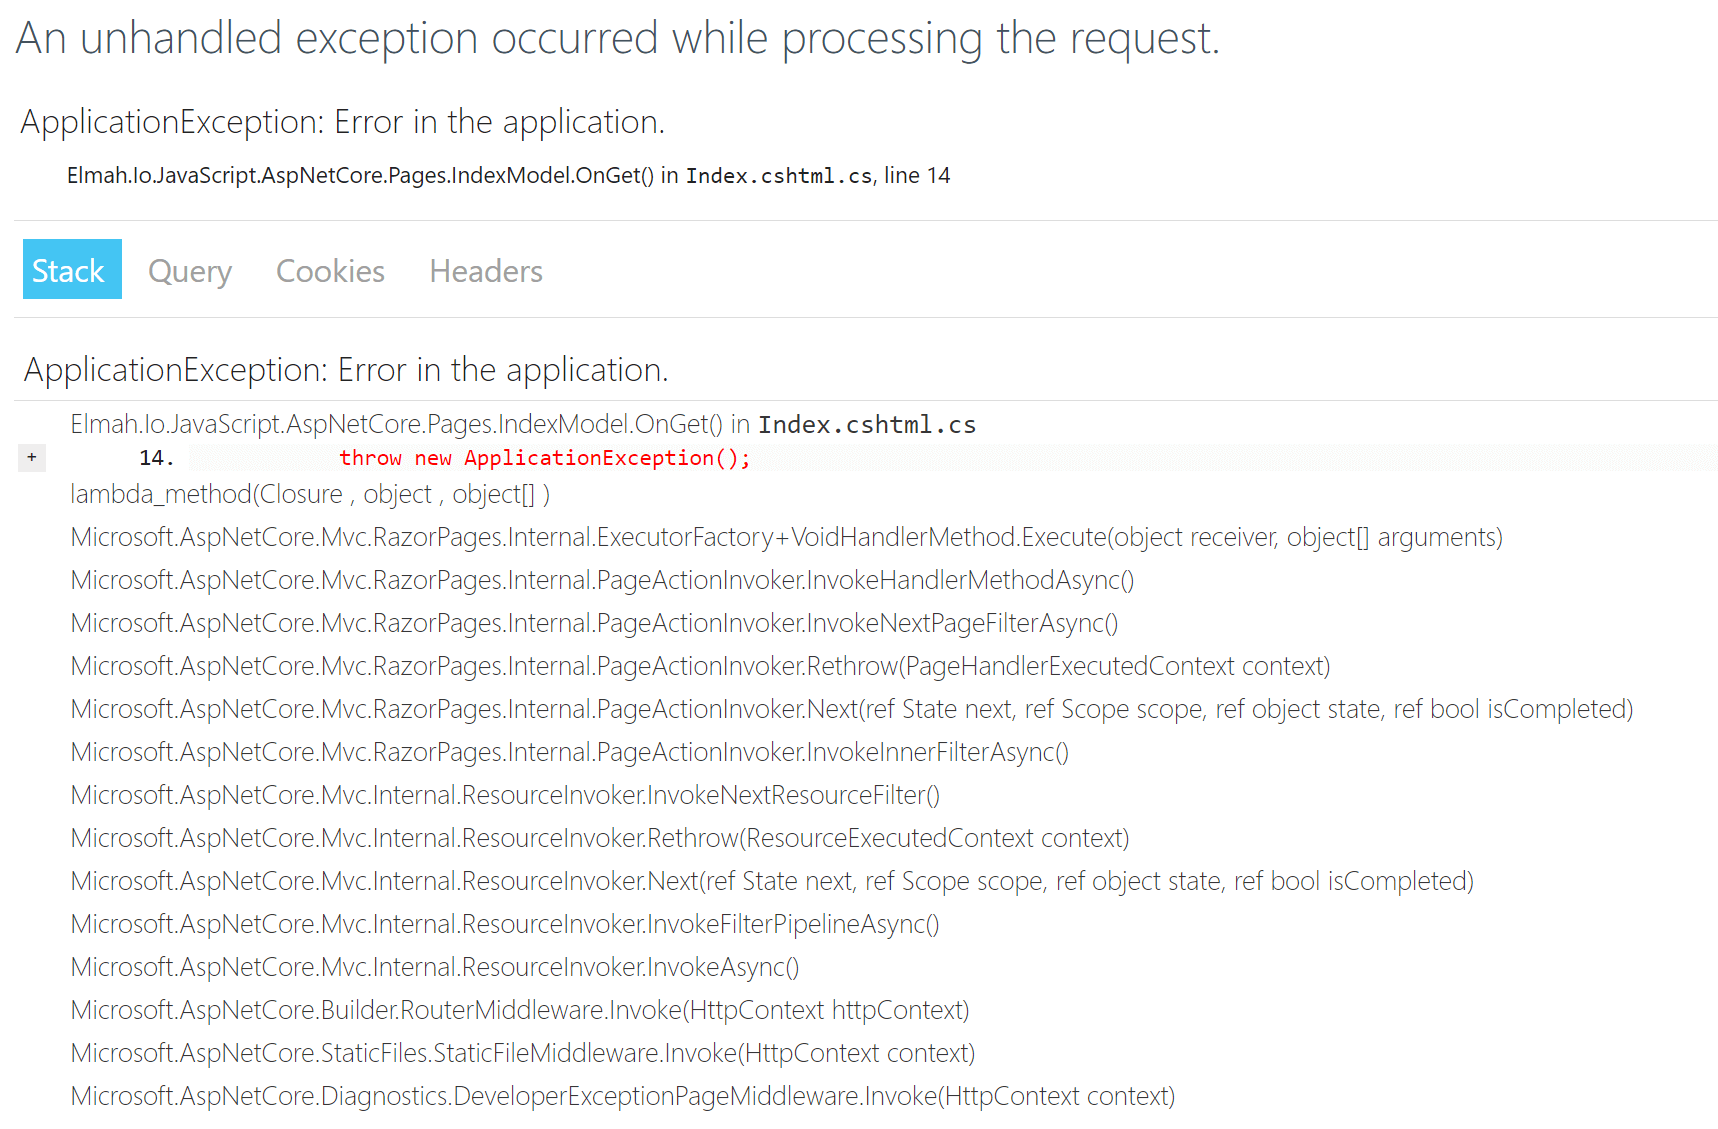
The typical website doesn't need to show pretty printed exceptions to end-users. You could be implementing a system like elmah.io, StackOverflow, a developer tool, or something similar. You could also have a special version of your error page that you are using for debugging purposes. The yellow and white screens of death aren't exactly things of beauty:
Here's a quick way to pretty print a .NET stack trace. Let's imagine that you have an unformatted stack trace in a code element somewhere on your website:
<pre>
    <code class="stacktrace">System.FormatException: Input string was not in a correct format.   at System.Number.ThrowOverflowOrFormatException(ParsingStatus status, TypeCode type)   at System.Number.ParseInt32(ReadOnlySpan`1 value, NumberStyles styles, NumberFormatInfo info)   at System.Int32.Parse(String s)   at yNamespace.IntParser.Parse(String s) in C:\apps\MyNamespace\IntParser.cs:line 11   at MyNamespace.Program.Main(String[] args) in C:\apps\MyNamespace\Program.cs:line 12</code>
</pre>
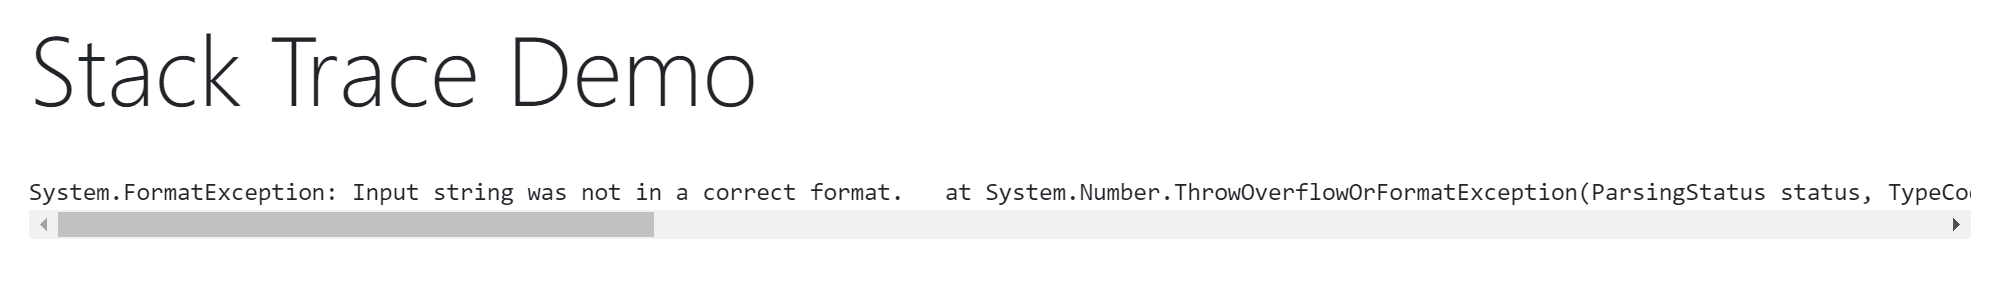
Showing this in the browser isn't ideal:
The Dude explains this way better than me:

To create something better, I will include the netstack.js JavaScript library. It is built on top of jQuery, so include that as well:
<script src="https://cdn.jsdelivr.net/npm/jquery@latest/dist/jquery.min.js"></script>
<script src="https://cdn.jsdelivr.net/npm/netstack.js@latest/netstack.js"></script>
The only thing left is to let netstack.js know what to highlight:
(function () {
    $('.stacktrace').netStack({
        prettyprint: true
    });
})();
In case you are not familiar with jQuery, the script simply calls the netStack function on all elements with the stacktrace class. The prettyprint option tells netstack.js to not only add CSS classes on the output, but also format the exception on the page.
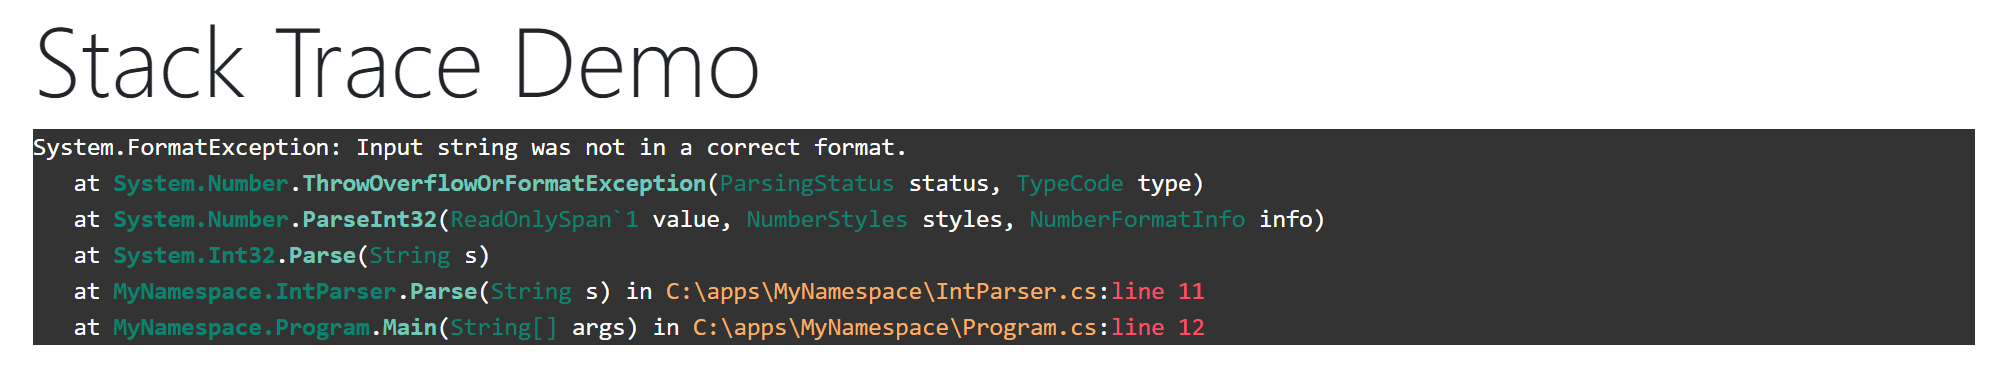
Looking at the page, the stack trace is now formatted and highlighted:
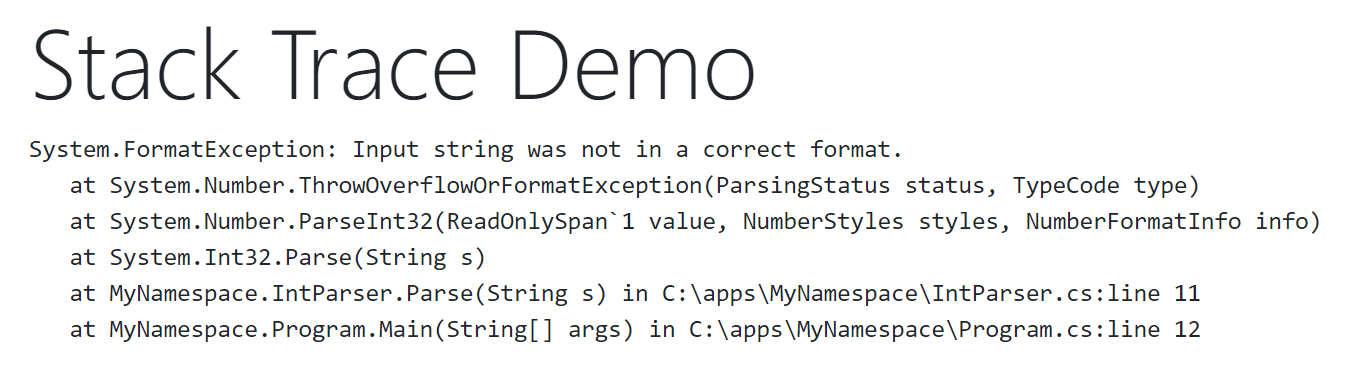
Each line is indented and formatted as expected when looking at a .NET stack trace. But wait, there's more. Under the hood, netstack.js added CSS classes to all of the times, methods, parameters, etc. Adding styling can be easily done by including some CSS:
pre, code {background-color:#333; color: #ffffff;}
.st-type {color: #0a8472; font-weight: bolder;}
.st-method {color: #70c9ba; font-weight: bolder;}
.st-frame-params {color: #ffffff; font-weight: normal;}
.st-param-type {color: #0a8472;}
.st-param-name {color: #ffffff;}
.st-file {color:#f8b068;}
.st-line {color:#ff4f68;}
This predefined look is copied directly from the example on npm, but you can define your custom style if you'd like. The result looks great:
elmah.io: Error logging and Uptime Monitoring for your web apps
This blog post is brought to you by elmah.io. elmah.io is error logging, uptime monitoring, deployment tracking, and service heartbeats for your .NET and JavaScript applications. Stop relying on your users to notify you when something is wrong or dig through hundreds of megabytes of log files spread across servers. With elmah.io, we store all of your log messages, notify you through popular channels like email, Slack, and Microsoft Teams, and help you fix errors fast.

See how we can help you monitor your website for crashes Monitor your website