Introducing the new Visual Studio extension
Finally, we are ready to unveil what we have been working on (among a lot of other stuff) the last weeks. Please welcome the elmah.io Browser – our new Visual Studio extension!
Like you, we are using elmah.io to track errors on our websites (including elmah.io). We spend almost all of our day inside Visual Studio coding, why integrating error logs inside our favorite IDE was an obvious choice. Let me show you how to get up and running.
-
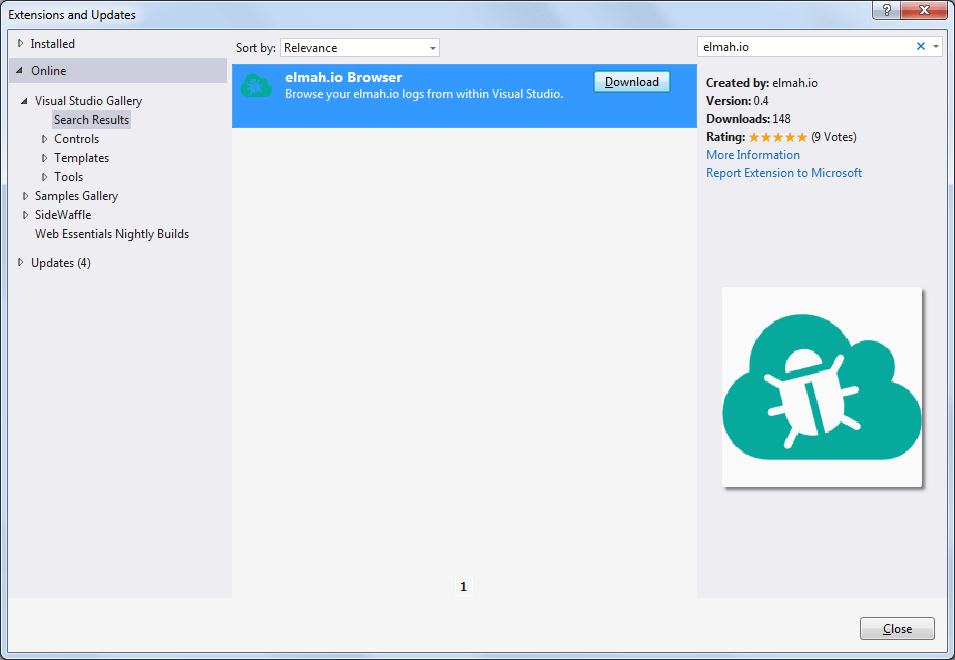
Inside Visual Studio navigate to Tools | Extensions and Updates | Online and search for elmah.io:

-
Hit Download and restart Visual Studio.
-
You’ll find the elmah.io Browser through View | Other Windows | elmah.io Browser or by searching for it through Quick Launch (Ctrl+Q).
-
When launched, a new tool window appears, which can be docked if you’d like. To start browsing your logs, hit the log in icon to the left:

-
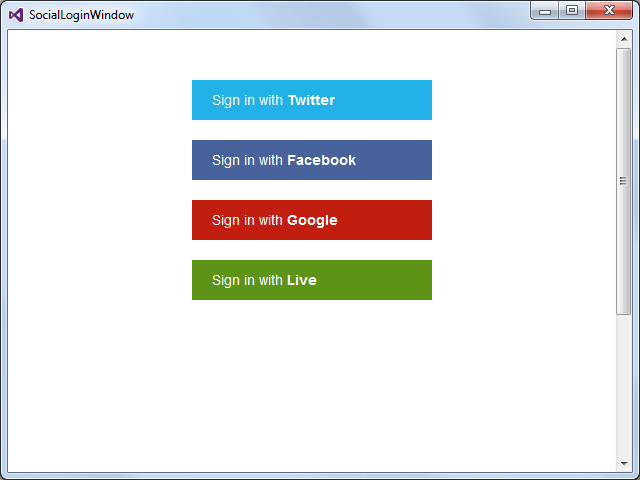
Log in with the social account used on elmah.io:

-
When logged on, the Log combo box contains a list of your logs. Select one and hit the search icon:

There you go: full elmah.io log browsing support inside VS. You can double click each row and check out the details directly on the elmah.io website.
We have a lot in store for the extension. But as usual we’d love your feedback so please try out the extension and get back to us.
elmah.io: Error logging and Uptime Monitoring for your web apps
This blog post is brought to you by elmah.io. elmah.io is error logging, uptime monitoring, deployment tracking, and service heartbeats for your .NET and JavaScript applications. Stop relying on your users to notify you when something is wrong or dig through hundreds of megabytes of log files spread across servers. With elmah.io, we store all of your log messages, notify you through popular channels like email, Slack, and Microsoft Teams, and help you fix errors fast.
See how we can help you monitor your website for crashes Monitor your website
