
9 "hidden" features in Visual Studio that you may not know
Visual Studio is probably the tool I use most throughout my week. It's such a versatile tool with lots of features. The downside of the extent of buttons and options is that it offers some features that you didn't even know about it. I constantly discover new features, some years old and others brand new. In this post, I'll share a list of features that some of you may not know. If you know them all, feel free to add a "Visual Studio Wizard 🧙" title to your LinkedIn.

Without further ado, let's dig straight down into the list. Presented in random order.
Create project reference with drag and drop
When classes in one project need to know about classes in another, you can create a project reference. For a decade, I have done this by right-clicking the Dependencies node in the source project, selecting Add Project Reference... and enabling the checkbox next to the destination project. I didn't really think about another way of doing this until Karen Payne revealed a little drag-and-drop hack in this post. Simply drag the project you want a reference to in the solution explorer to the project you want a reference from:
GitHub Actions in Solution Explorer
If you, like us, are using GitHub Actions to build your code, there's a nice little feature in the Solution Explorer. If there is one or more YML-based build files in the .github folder, Visual Studio will show a 'GitHub Actions' node with a cute little GitHub logo. This is mostly a visual treat, but right-clicking will let you open the workflow directly in the browser:
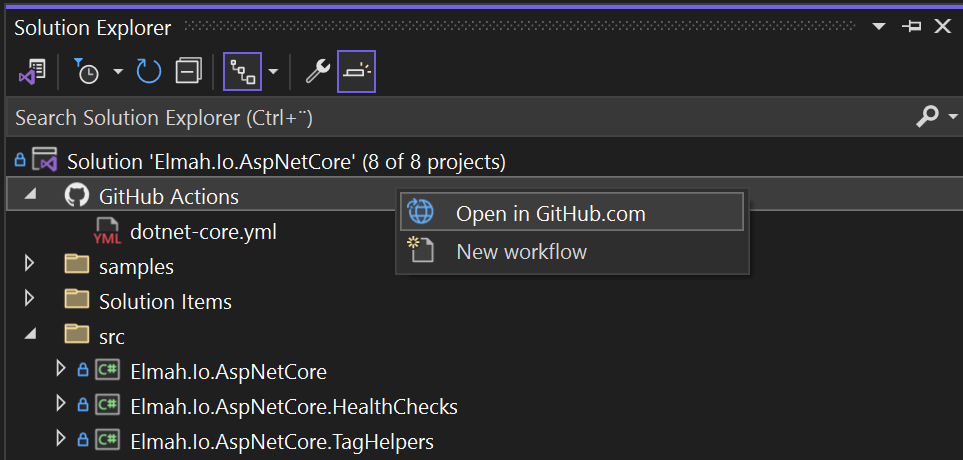
For now, the 'GitHub Actions' node only shows as long as there's an ASP.NET Core project in the solution. I'm hoping Microsoft will include this for all project types.
CPU and memory profiler
I often see people asking for free CPU and/or memory profilers. And they are often surprised to see that Visual Studio comes with both built in. TBH, I think that there are better tools out there. Like dotTrace and dotMemory from JetBrains. But the one in Visual Studio works fine for a quick look.
This is not a guide to use the profiler (I can create one if enough people request it). But in short, you use the Diagnostics window inside Visual Studio, shown when launching a project in Debug mode:
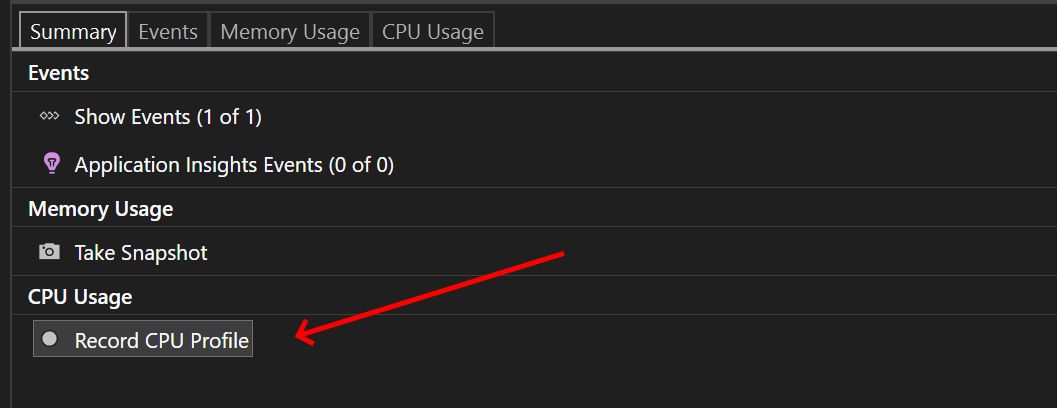
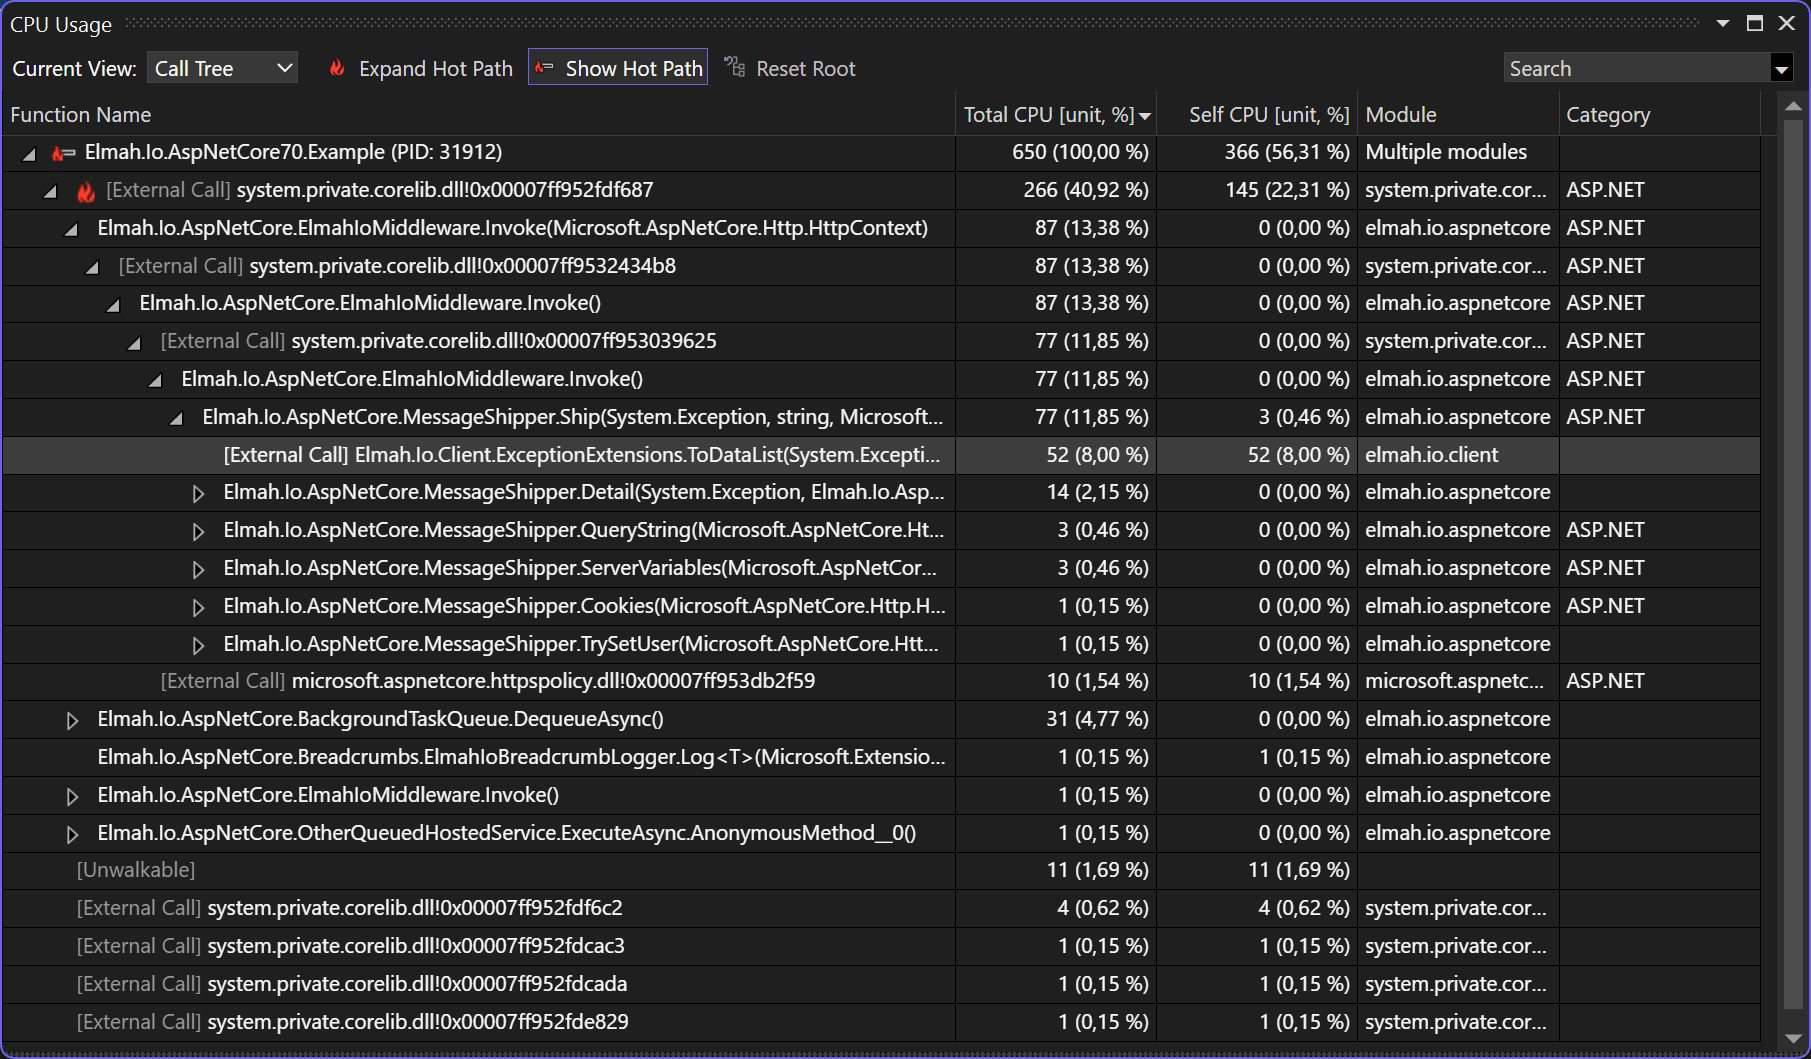
The easiest way to pick which session to profile is to set a breakpoint at the start and end. When hitting the start breakpoint, enable profiling. Visual Studio will automatically show the profiling result when hitting subsequent breakpoints:
The memory profiler works similarly.
Copy code with correct indentation
This is brand new. At least from the time of writing this post. It always bugged me that when having to copy code from Visual Studio to another tool like this blog, any preceding spaces (or tabs if you are on the tab team) would get copied too. I typically did it like this:
From Visual Studio 2022 version 17.7 and forward, copying code will follow the indentation from the first line:
The most awesome thing about this feature is that it was something I suggested to Microsoft through the Developer Community and then fixed.
Multiple profiles
Visual Studio saves all of the options, window location, open files, etc. across sessions. This is typically what you want to avoid having to re-configure everything every time you launch VS. But what if you are using the same computer for both work and private open-source work? Or across multiple customers. Or want one set of settings during the day and another during the night.
Visual Studio supports a program setting named rootsuffix that can help you implement multiple profiles. Simply create a shortcut to VS with that extra parameter to get a brand new "profile" with all new settings. As shown in the following example:
"C:\Program Files\Microsoft Visual Studio\2022\Professional\Common7\IDE\devenv.exe" /rootsuffix private
The first time you click this shortcut, you will see the initial VS loading screen that you probably forgot everything about. That means that VS launches a brand new instance.
Cleanup unused Azure Functions Core Tools
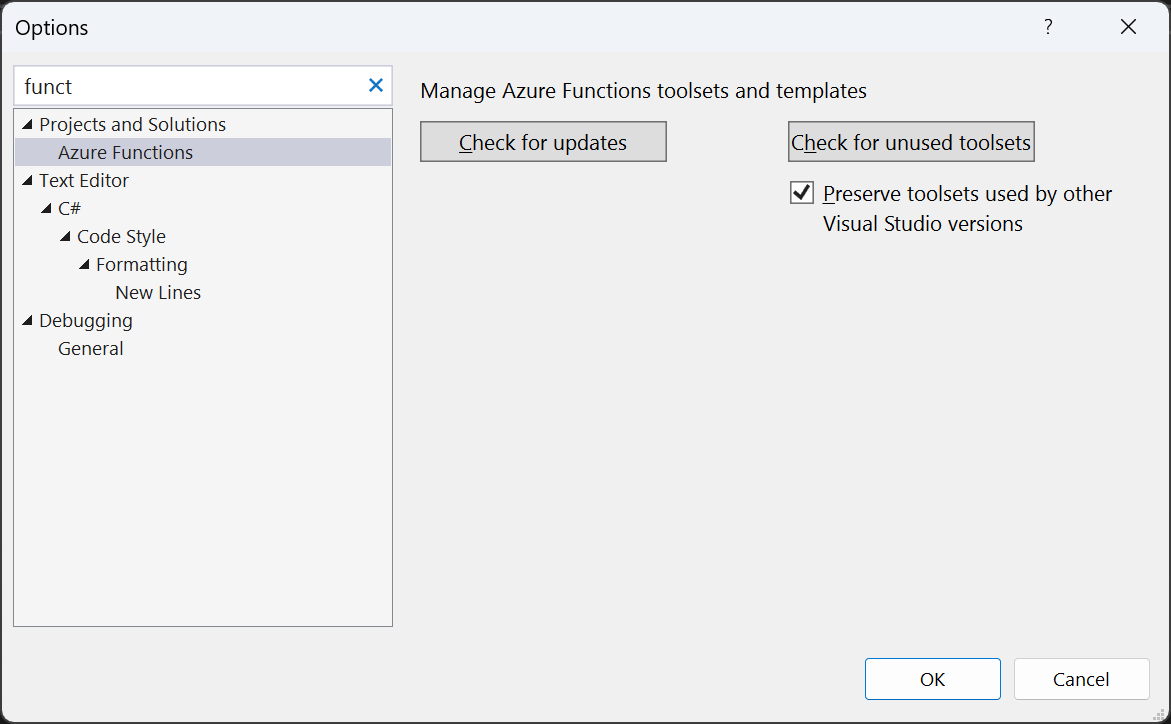
This one is for developers using Azure Functions. When you run a function app, the Azure Functions Core Tools are automatically updated if there's a new version available. The tool is installed in the c:\Users\<user>\AppData\Local\AzureFunctionsTools\Releases\ folder with a folder for each version. Each version is between 100-200 MB, so a few years of history quickly takes up quite some space. You can delete unused versions manually. But there's actually a nice little feature to help you do this inside of Visual Studio.
Navigate to Tools | Options... | Projects and Solutions | Azure Functions. Click the Check for unused toolsets button:
Display diagnostics inline
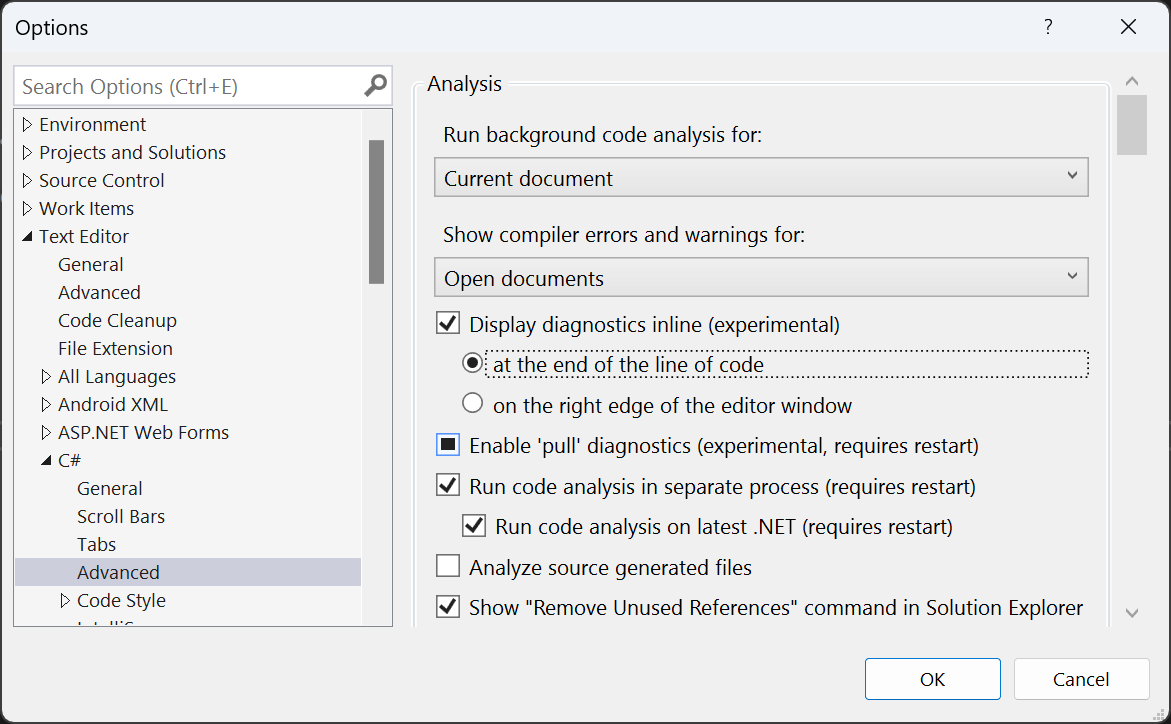
Visual Studio sometimes comes with experimental features. Often provided through extensions, but I believe this one is built in. VS shows curly lines beneath code that is either invalid (would cause a compile error), contains a warning, or in other ways have suggestions to them. You can hover the line to see the suggestion or navigate to the Error List window to see the details. One experiment that I really like is showing the message inline as shown here:
I know that someone will probably hate this, but give it a try by going to Tools | Options... | Text Editor | C# | Advanced and enabling the Display diagnostics inline checkbox:
IntelliSense for JSON files
Some JSON files already come with IntelliSense, like the appsettings.json file. All this is done with the magic of JSON schema files on a service named JSON Schema Store. The site contains JSON schemas for almost everything you can think of, from Microsoft technologies to various build servers and non-Microsoft clouds. If Visual Studio doesn't pick up the schema itself, go to JSON Schema Store and find the JSON Schema for the JSON files you need IntelliSense for (like https://www.schemastore.org/bundleconfig.json). Then, in the JSON editor inside VS, insert the URL in the Schema field above the content:
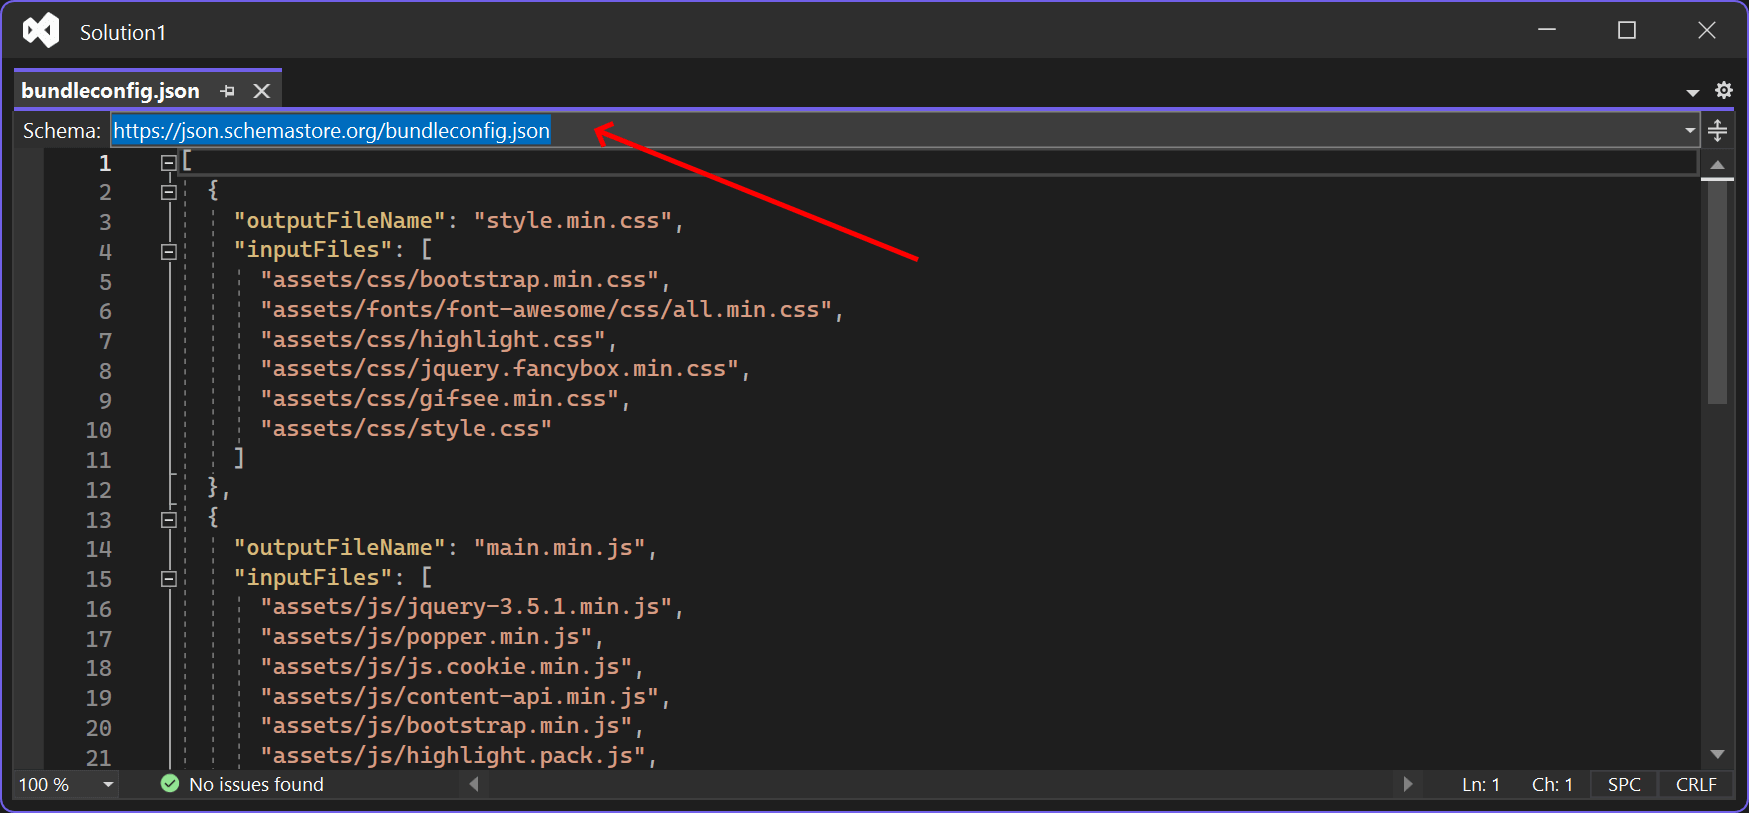
As already mentioned, VS automatically detects a large number of schemas. But for rarer files, this is a game-changer. If VS doesn't pick up the schema automatically, you can also add a $schema property at the top of your JSON file like this:
{
  "$schema": "https://json.schemastore.org/bundleconfig.json",
  ...
}
Playing sounds on interesting events
If your build and/or test takes more than a few seconds, you may switch to a quick Reddit session while Visual Studio does the hard work. A few minutes on Reddit quickly becomes half an hour. This surely doesn't apply to you, but you have "a friend" doing this 😝. Setting up VS to play sounds indicating both build and test status can help "your friend" get back to work.
If you go to the Sounds application available in Windows, there's a whole section dedicated to Visual Studio:
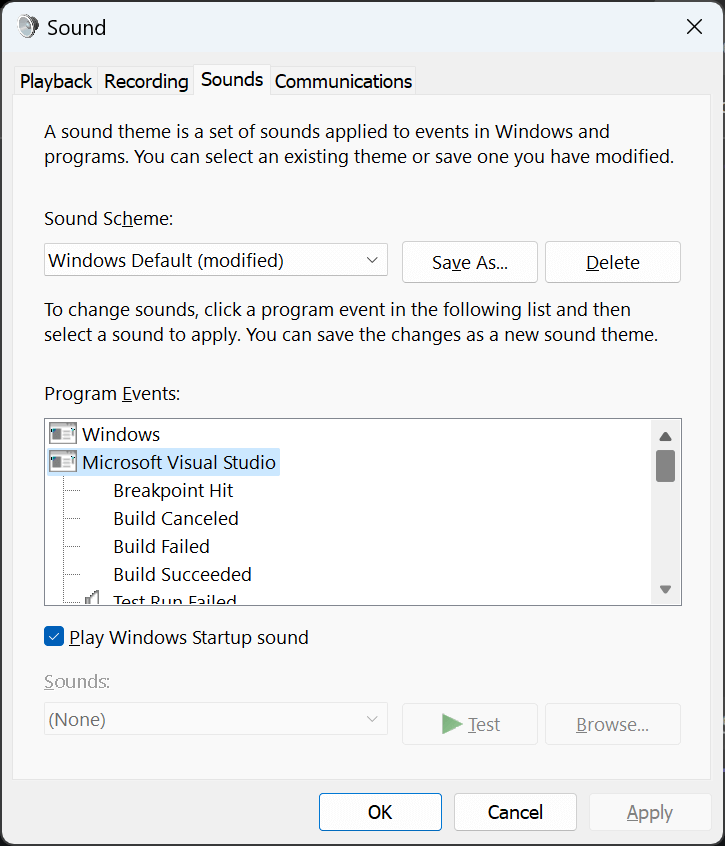
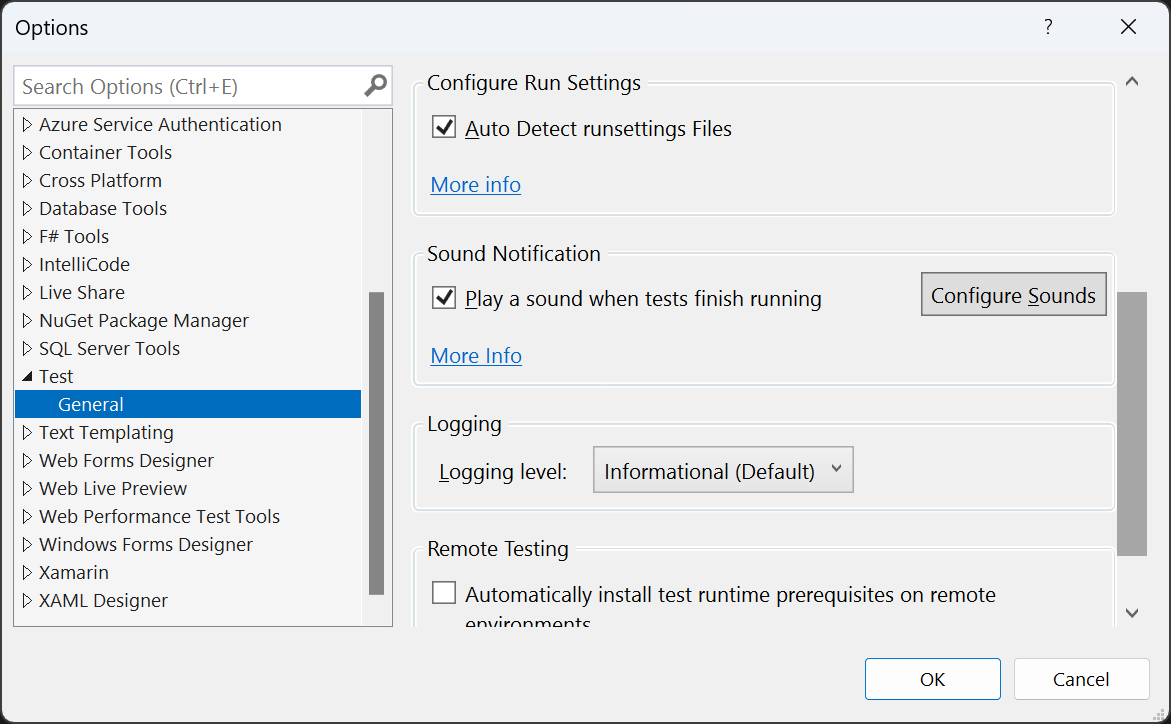
You can set up different sounds for interesting events like Build Failed and Test Run Failed. The sounds need to be enabled in Visual Studio as well. Go to Tools | Options... | Test | General and enable the Play a sound when tests finish running checkbox:
That's it! I hope you found something useful and feel free to send your own tips for hidden/unknown features.
elmah.io: Error logging and Uptime Monitoring for your web apps
This blog post is brought to you by elmah.io. elmah.io is error logging, uptime monitoring, deployment tracking, and service heartbeats for your .NET and JavaScript applications. Stop relying on your users to notify you when something is wrong or dig through hundreds of megabytes of log files spread across servers. With elmah.io, we store all of your log messages, notify you through popular channels like email, Slack, and Microsoft Teams, and help you fix errors fast.

See how we can help you monitor your website for crashes Monitor your website