
Visualizing LINQ Queries with LINQPad: Boost Your EF Core Debugging
Ever feel exhausted debugging a complex EF Core query? Do you wonder what went wrong in the EF Core LINQ query spaghetti that hinders the results? At one end, EF Core and LINQ accelerate the development speed and make it easy to communicate with a database. However, its intermediate results lack visualization. Today, I will introduce you to LINQPad, a visualizer tool for EF Core and more. LINQPad allows you to interact with the database intuitively. Let's dive into the post to know more about this remarkable tool.

What is LINQPad?
LINQPad is a lightweight, interactive tool for querying, debugging, and visualizing .NET code and database queries. LINQPad not only works with LINQ queries but also supports C#/F#/VB expressions, statement blocks, or programs. LINQPad was introduced in 2007 by Joe Albahari. Since then, it has been a popular tool among developers.
What You Can Do with LINQPad
Query Databases
LINQPad offers a query tool for a range of popular databases, including SQL Server, PostgreSQL, SQLite, MySQL, and even Oracle. You can write LINQ or raw SQL right inside LINQPad and see the results instantly, just like any query executer.
Explore Data Interactively
Allows you to navigate through tables, follow relationships, and inspect query results with a point-and-click data explorer. It feels more like exploring than debugging.
Experiment Without a Project
To test any code or query, you usually had to make a tedious task of creating a project. But with LINQPad, you can test out C#, F#, or VB.NET snippets without spinning up a whole Visual Studio project, making it a perfect scratchpad for quick experiments.
Peek Behind EF Core Queries
Helps you visualize the SQL generated by your LINQ. LINQPad can reveal the exact query sent to the database, allowing you to optimize and debug more effectively.
Navigate the Roslyn syntax tree
LINQPad shows you the Roslyn tree executed for the query or statement.
Bring in NuGet Packages
You can perform more operations by adding a NuGet package with LINQPad. It allows you to download packages, play around with just code, and run.
How to install and set up LINQPad?
Covering every feature of LINQPad is challenging, so I'll focus on a few that you will frequently need in your projects.
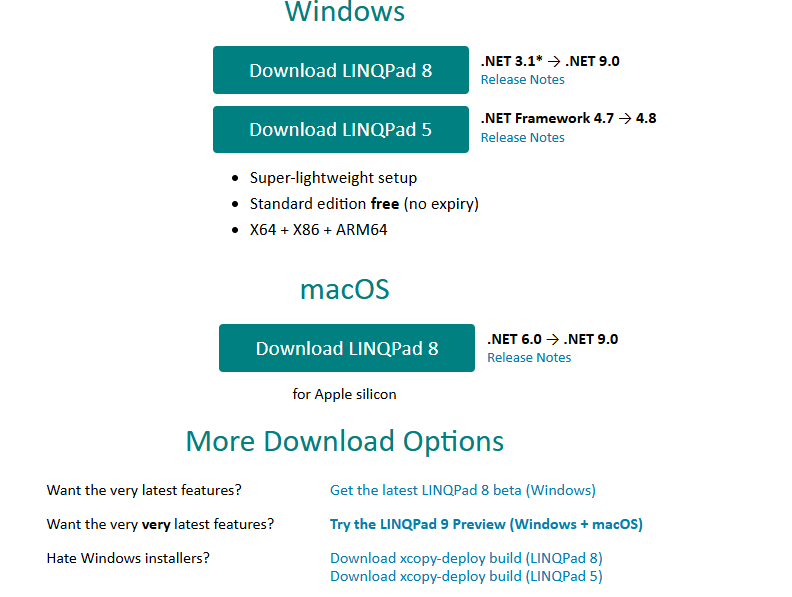
Step 1: Download LINQPad Setup
Navigate to the installation page https://www.linqpad.net/Download.aspx. Here, you can find various options and choose one that suits your computer and OS.
Step 2: Installation
Your download will look as if you have a Windows PC like mine.

Double-click on it and follow the installation procedure.
Step 3: Connect a database
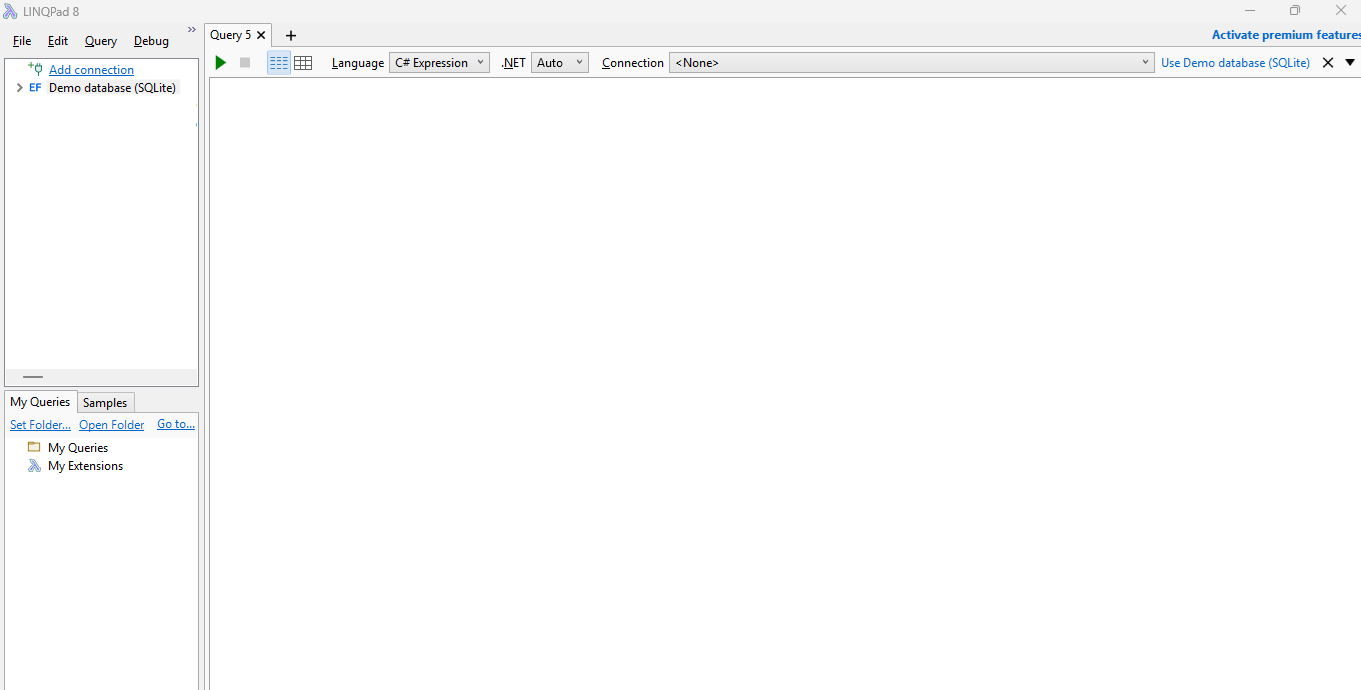
Once installation succeeds, open LINQPad. On the left side, you will find Database Explorer.
When launching LINQPad you will see a window similar to this:
Visualizing table data with LINQPad
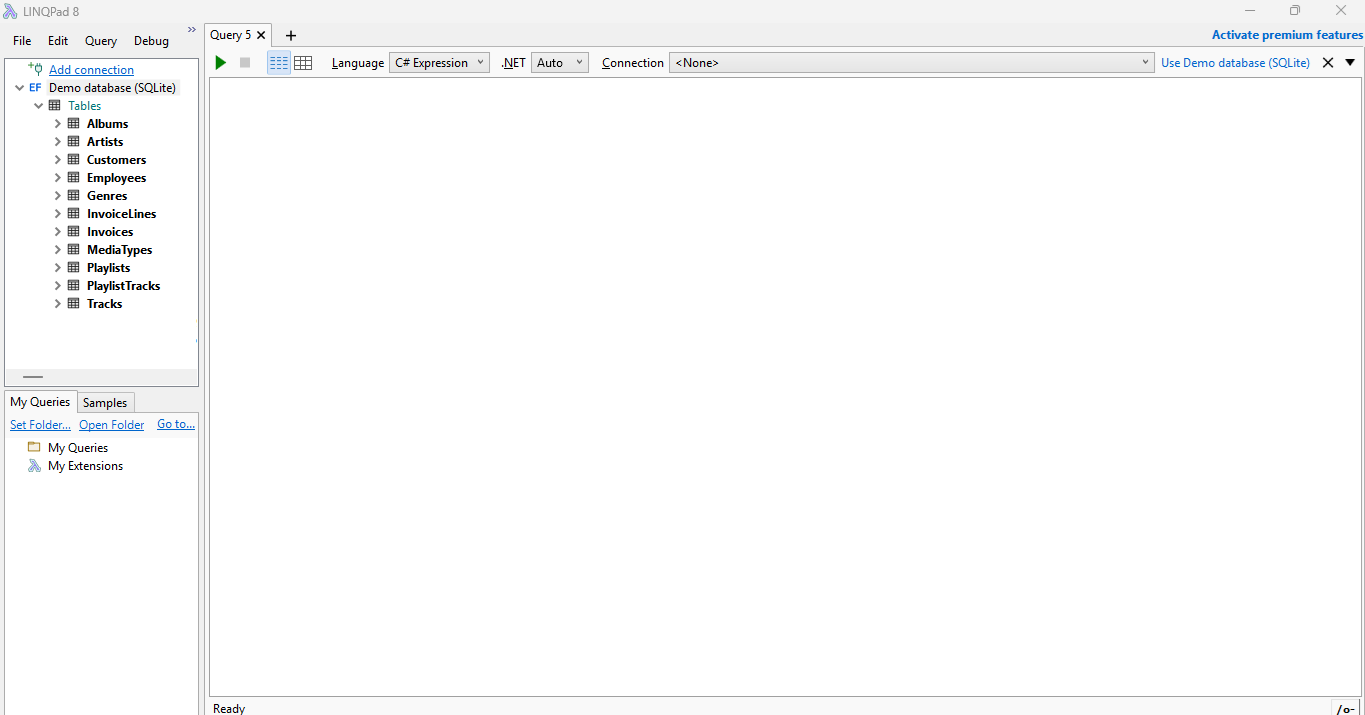
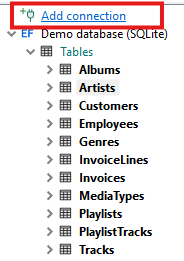
By default, LINQPad provides a test database. Upon expanding, you will see the tables in that database:
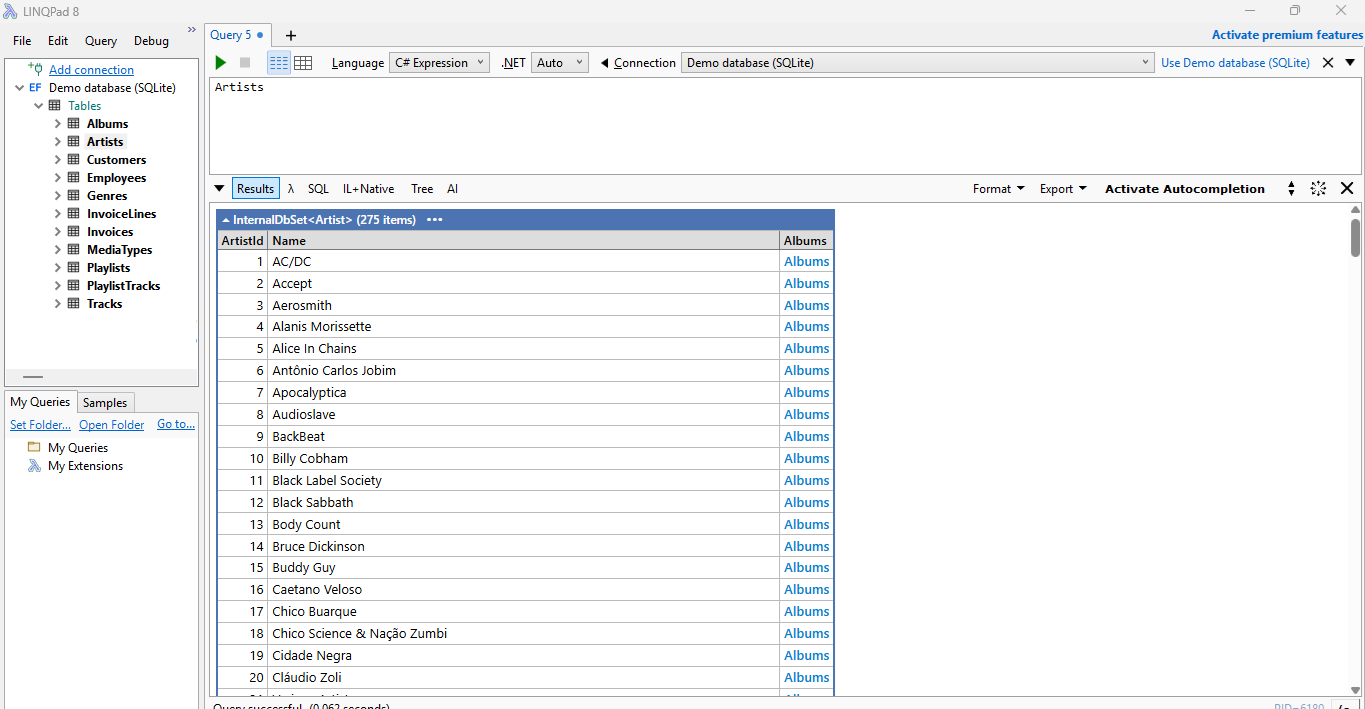
Now the magic starts. I simply ran a query with the table name without any SELECT query, and the result printed all records. You can see there is a navigation link on the Albums, just like EF Core has navigation, but this one is interactive. When clicking on Albums, we see an embedded view:
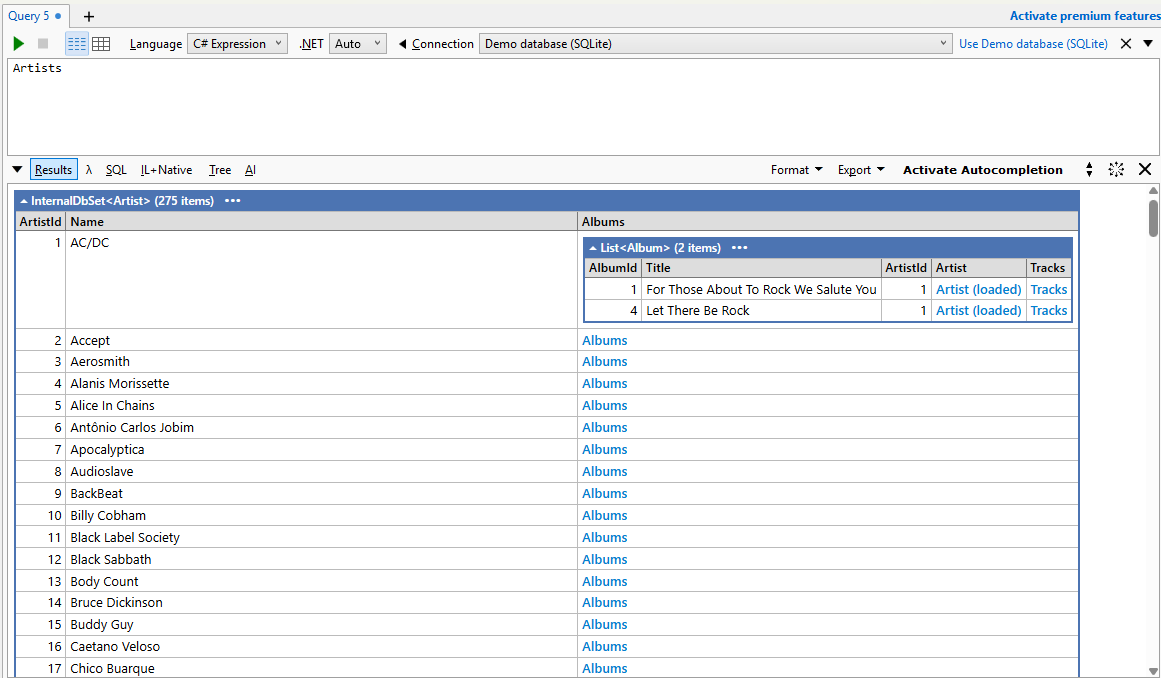
The referenced Albums are listed here with all of their columns. Upon clicking the tracks, we can further see the referenced tracks for an album:
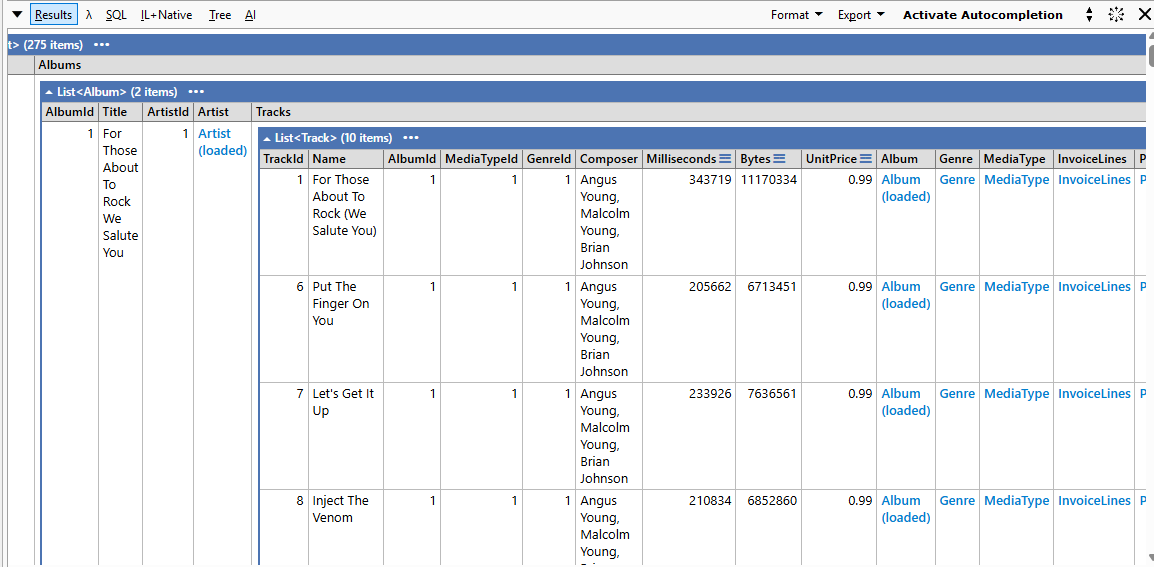
However, this time it doesn't fit in one picture due to the large number of items (10 in this case), but you can scroll through it. Still, we can drill down further into Genre and MediaType.
Connect Database in LINQPad
Until now, we have used the demo SQLite database available in LINQPad. Let's understand how you can connect your database here.
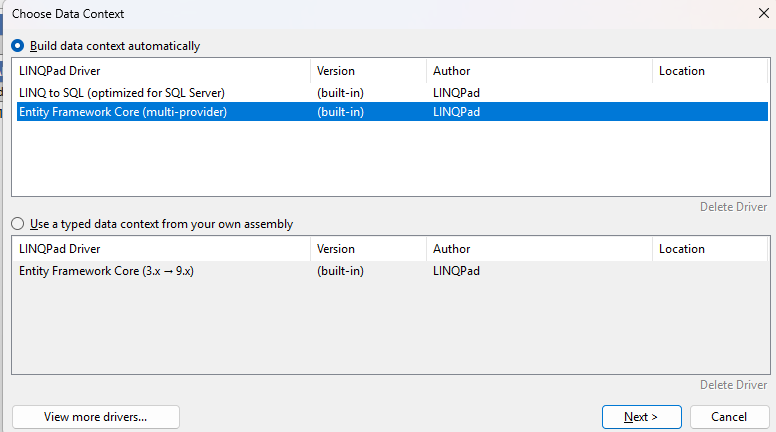
Step 1: Choose the driver.
Click on the Add connection link in the explorer:
I want to connect my PostgreSQL database, whose pgAdmin view is as follows:

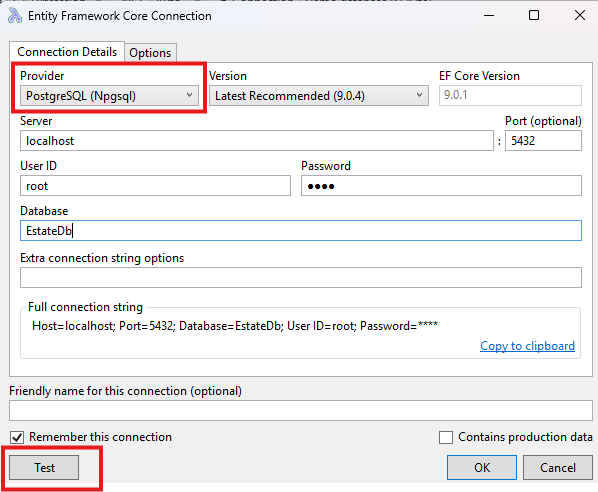
For SQL Server, PostgreSQL, MySQL, Oracle, and SQLite, an Entity Framework Core (multi-provider) driver is required:
Click Next, enter database details, set the Provider, and test the connection:
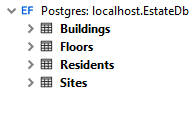
After clicking OK, our database is imported:
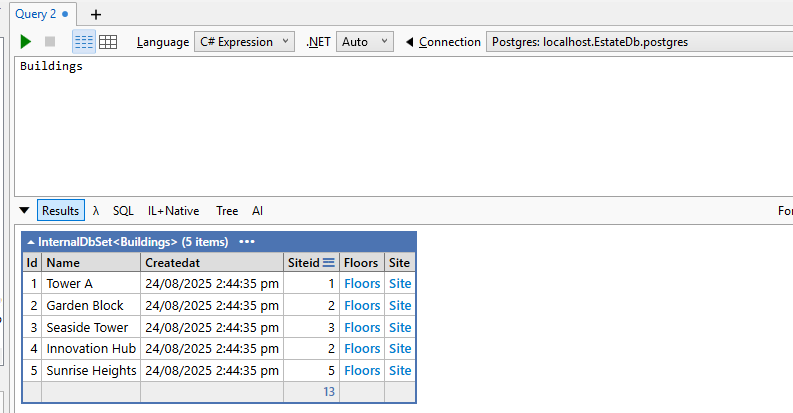
Upon dragging the Buildings table to the query window, we see the content:
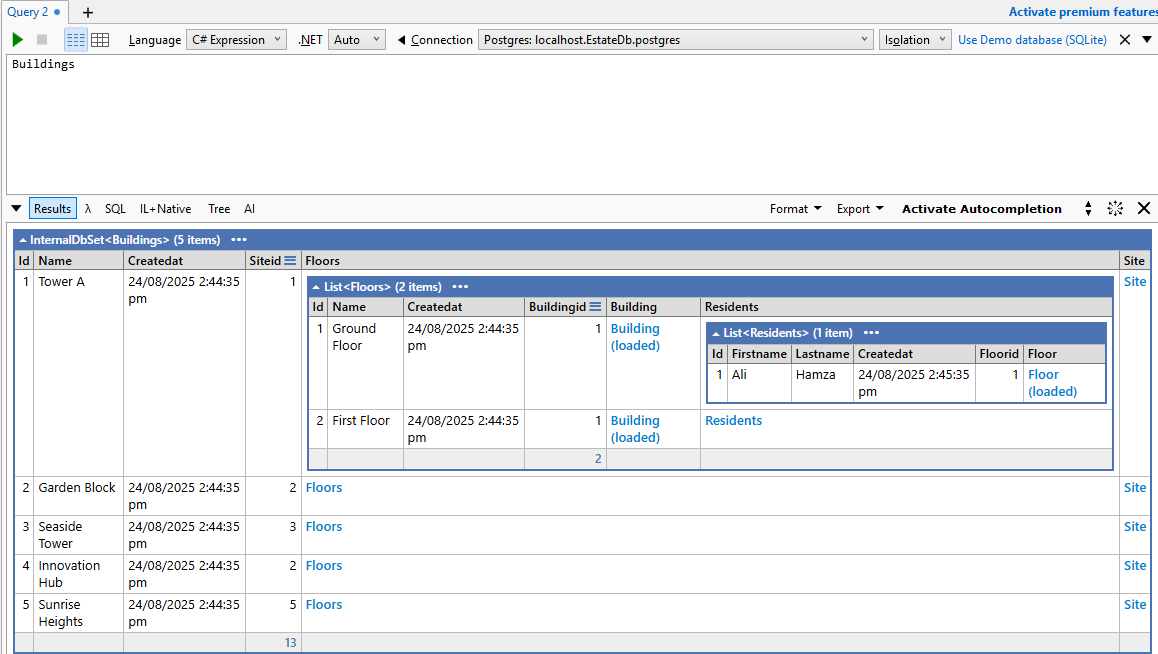
And like the demo database, we can dig down into relationships by clicking on the Floors and Site links:
Visualizing Basic LINQ Query
To query a table, you can simply write a LINQ query and run it on the database without creating a project:
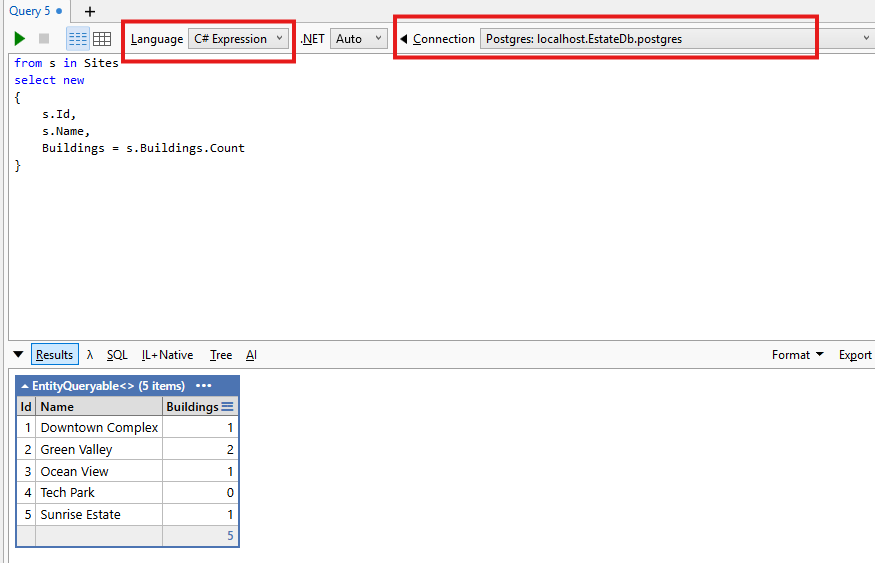
Make sure to select the appropriate Language and Connection in the toolbar. I selected C# expression because LINQ is the connection for the target database.
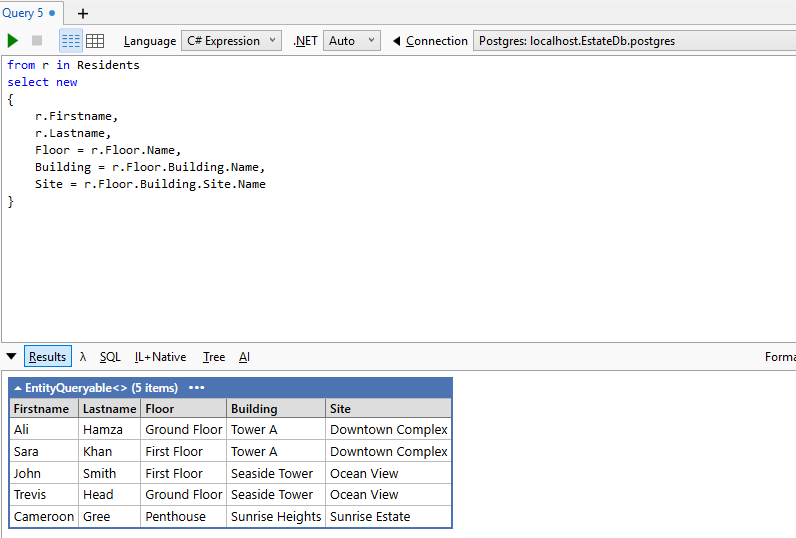
LINQ query with join
You can join multiple tables using LINQ similar to this:
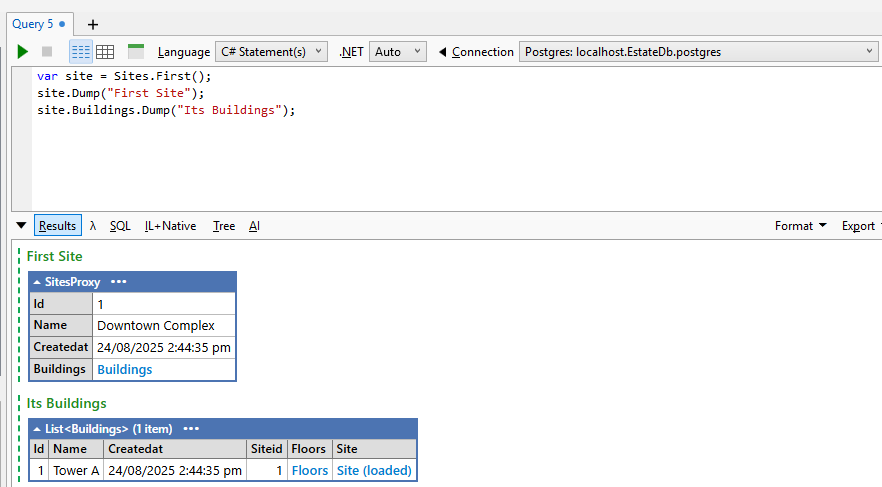
Dumping objects
Results can be printed to the Results view using C# Statement(s):
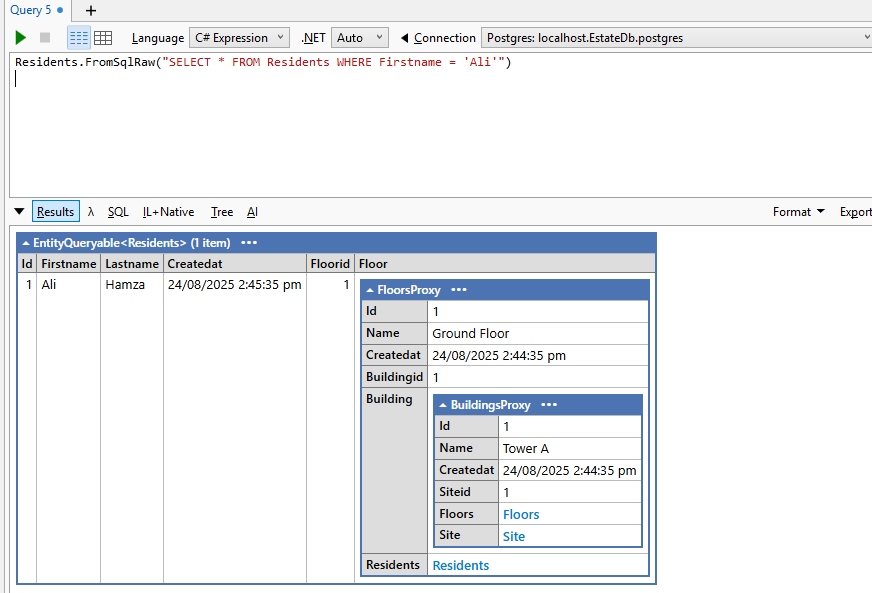
Raw SQL Query
You can simply run a Raw SQL query like you do in an EF Core application:
Mixed Example (both Expression + Statement)
You can combine an expression and a statement:
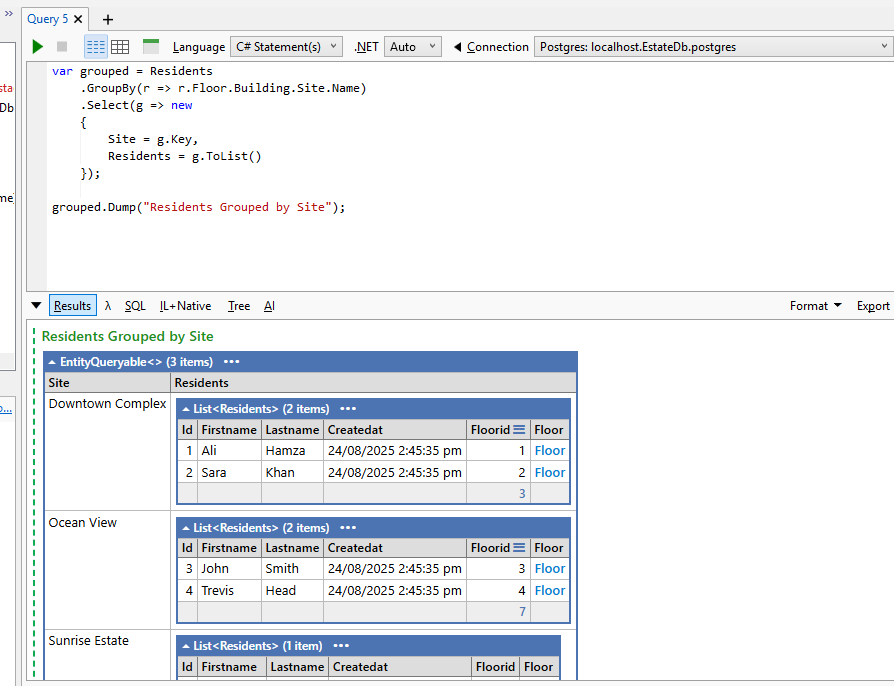
The LINQ part is an expression, but since we assign to grouped and then call Dump(), the whole block is statements.
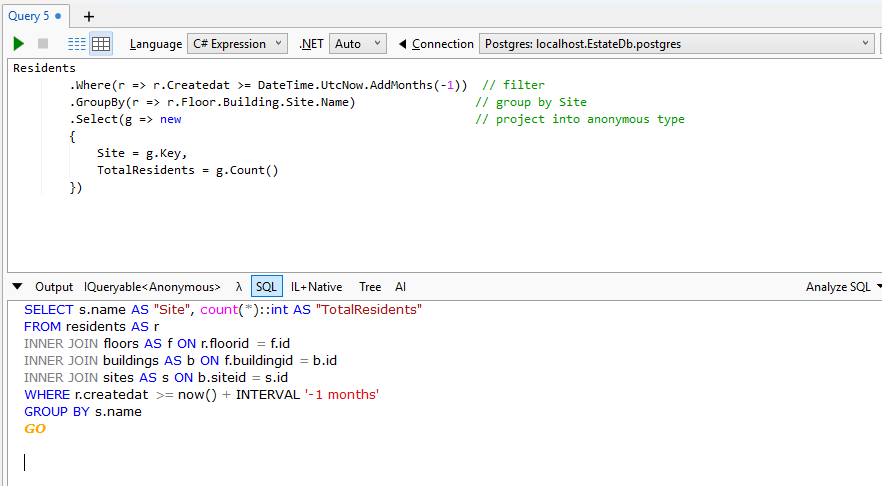
Get the Generated SQL Query
You can access the generated SQL query for any LINQ code by clicking the SQL tab:
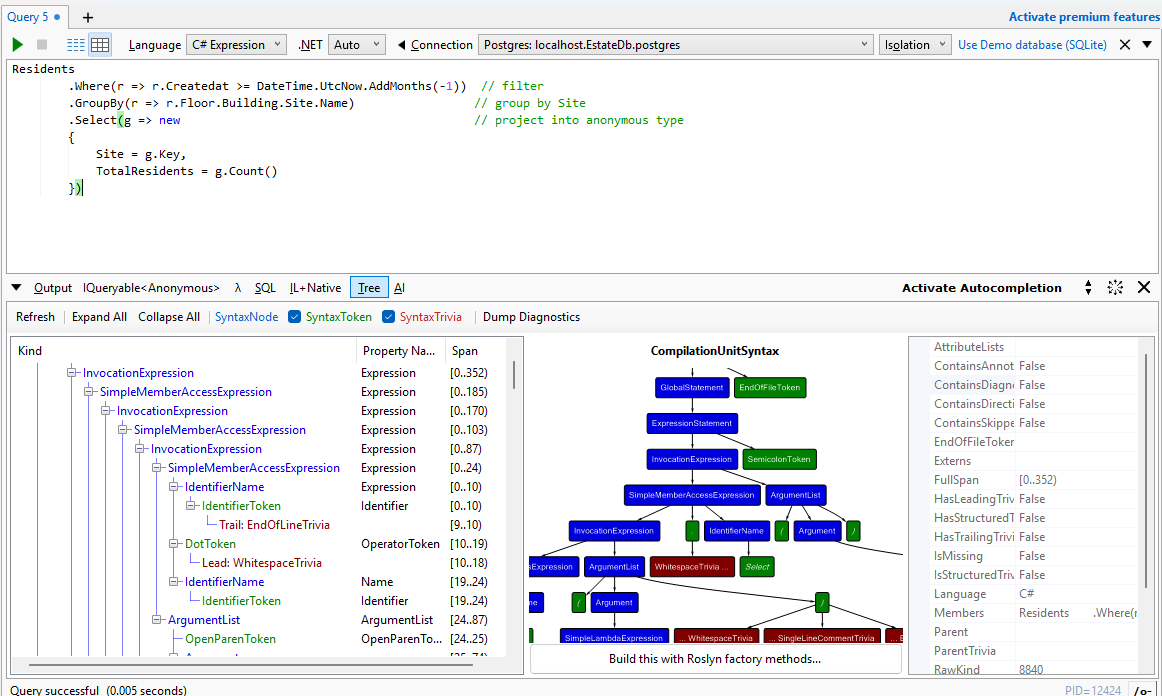
Analyze the Roslyn syntax tree.
One more remarkable feature LINQPad offers is giving you access to the Roslyn compiler's syntax tree for a query:
Visualizing part of a complex LINQ query
This one is a more practical scenario where LINQPad shines. Suppose you are writing a complex LINQ in the project. For many developers, LINQ queries are a black box. You can only view their end result, and you cannot debug what filter yields what results. Consider the following query:
var query =
    Residents
        .Where(r => r.CreatedAt >= DateTime.UtcNow.AddMonths(-1))  // filter
        .GroupBy(r => r.Floor.Building.Site.Name)                 // group by Site
        .Select(g => new                                          // project into anonymous type
        {
            Site = g.Key,
            TotalResidents = g.Count(),
            Latest = g.OrderByDescending(r => r.CreatedAt).FirstOrDefault()
        })
        .OrderByDescending(x => x.TotalResidents);
You can break them down into steps.
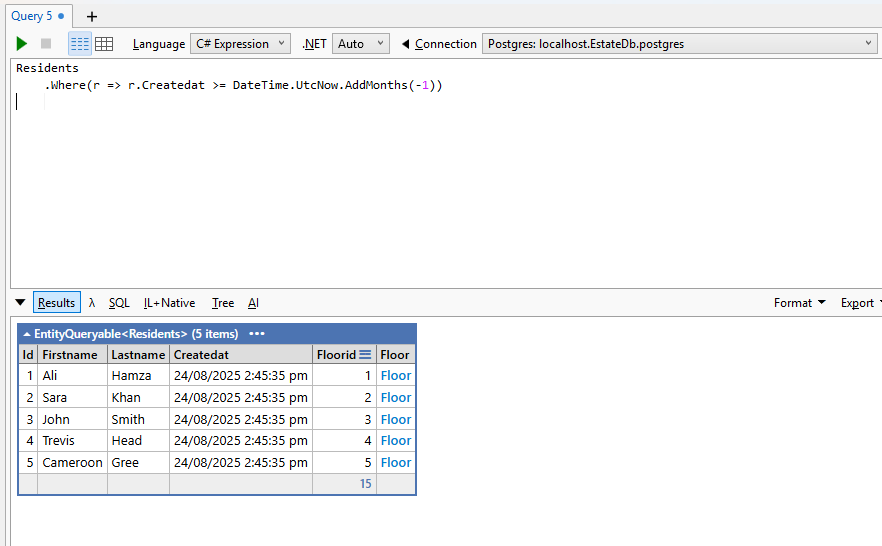
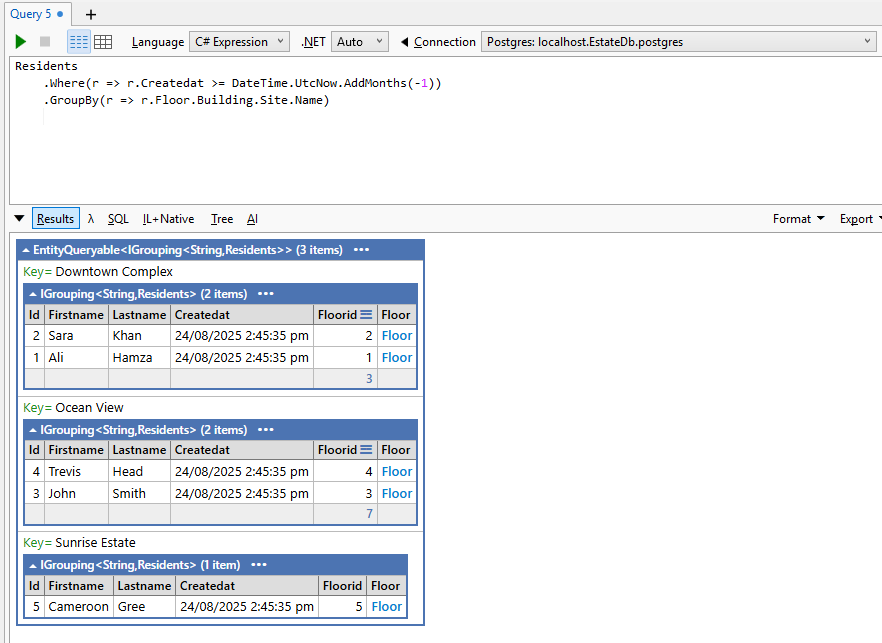
Step 1: Check the date filter
Step 2: Inspect grouping
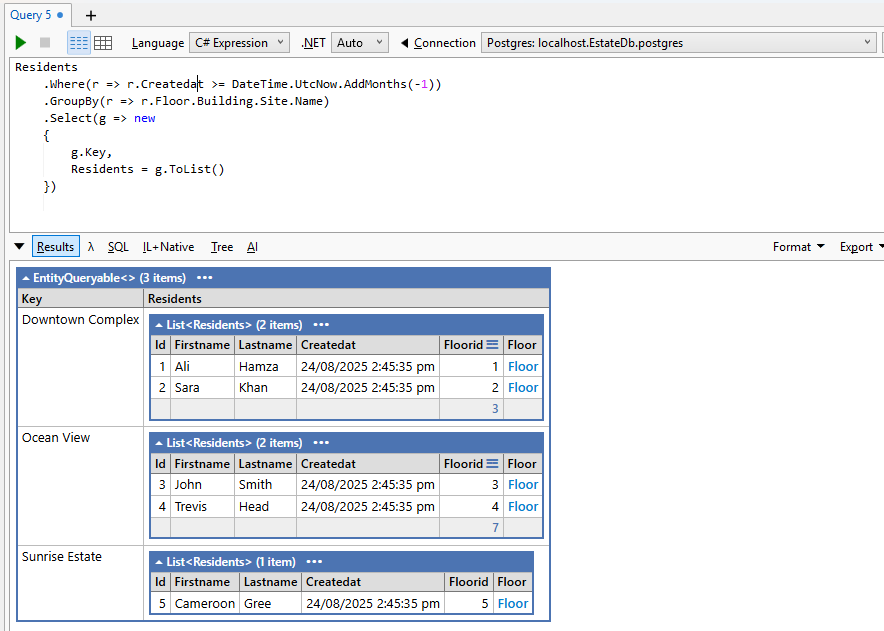
Step 3: Inspect grouping with projection
Step 4: Final query
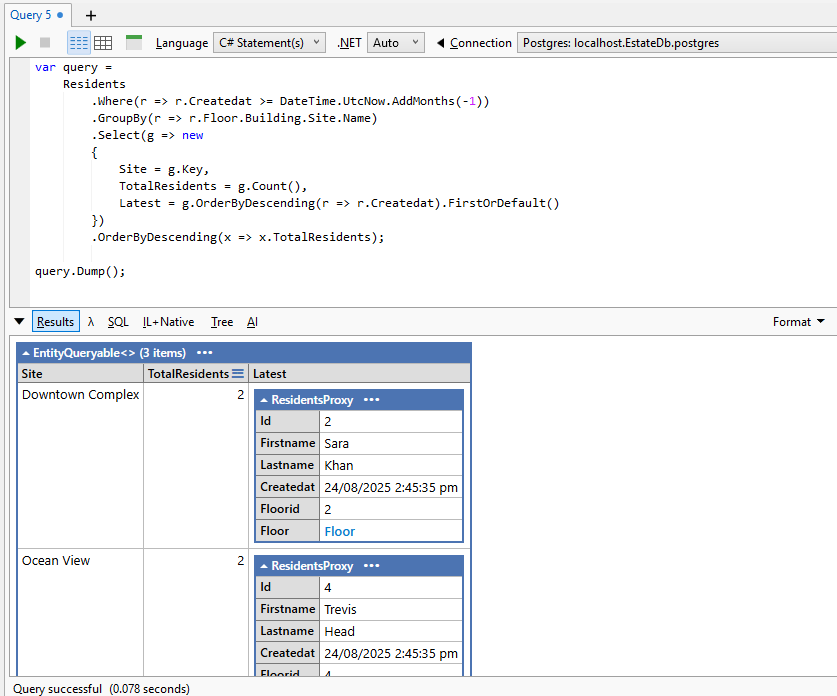
Here, you can easily unlayer the query step by step and visualize the results. This really helps identify at what step the query went wrong and did not return the desired output.
Conclusion
Visualizing LINQ requires debugging with breakpoints. However, breakpoints lack visualization in complex queries, which can lead to a boomerang situation. Also, to run a simple LINQ query, you need to define a whole new project with a database. To cope with all these, LINQPad came into play. LINQPad is a popular tool that helps you with all such problems. Because of its range of features for developers, LINQPad is officially called a .NET Swiss Army Knife. In this post, I shared some of the most common use cases in this blog that leverage this remarkable tool. The focus was on LINQ and EF Core only, but there are so many other use cases made possible with LINQPad.
elmah.io: Error logging and Uptime Monitoring for your web apps
This blog post is brought to you by elmah.io. elmah.io is error logging, uptime monitoring, deployment tracking, and service heartbeats for your .NET and JavaScript applications. Stop relying on your users to notify you when something is wrong or dig through hundreds of megabytes of log files spread across servers. With elmah.io, we store all of your log messages, notify you through popular channels like email, Slack, and Microsoft Teams, and help you fix errors fast.

See how we can help you monitor your website for crashes Monitor your website