Understanding .NET stack traces - A guide for developers
Stack traces are important for debugging and understanding exceptions in .NET applications. They provide detailed information about the error and the call stack when an exception occurs, allowing us as developers to investigate why an error happened. In this post, I'll walk you through the basics of reading .NET stack traces and explore more advanced scenarios, including how multiple types of stack traces can be combined.
Before we start looking at advanced types of stack traces, it's important to understand the basic structure of a .NET stack trace. Here's a basic example that I think everyone is familiar with:
System.NullReferenceException: Object reference not set to an instance of an object.
   at ConsoleApp.Program.MethodA() in C:\projects\ConsoleApp\Program.cs:line 20
   at ConsoleApp.Program.Main(String[] args) in C:\projects\ConsoleApp\Program.cs:line 10
This stack trace is simple but contains a lot of interesting information. Let's break it down into. The first line of the stack trace tells you the type of exception and includes a message that describes the error:
System.NullReferenceException: Object reference not set to an instance of an object.
System.NullReferenceException, indicates the specific type of exception that was thrown. In this case a NullReferenceException. The second part, Object reference not set to an instance of an object, is the error message. The message is a human-readable representation of the error and can provide additional context to the fully-qualified exception name.
The remaining lines include the actual call stack. The stack is a sequence of method calls that led to the exception. It's displayed in reverse order, meaning the most recent call (where the exception occurred) appears first:
at ConsoleApp.Program.MethodA() in C:\projects\ConsoleApp\Program.cs:line 20
at ConsoleApp.Program.Main(String[] args) in C:\projects\ConsoleApp\Program.cs:line 10
Each method call in the stack represents a step in the code. You can follow the path that led to the error by reading the stack trace from top to bottom. This helps in understanding the context and the sequence of methods that triggered the exception.
If you've ever carefully examined a .NET stack trace, you may have noticed that each line in the call stack begins with three spaces. While this detail might seem trivial at first, it actually plays an important role in how stack traces are formatted and displayed. The primary reason for the three spaces is to improve readability. Stack traces are often outputted in logs, consoles, or cloud loggers like elmah.io, where many different types of information are displayed together. The indentation created by these spaces helps visually distinguish the call stack from the exception message and other text around it. This slight indentation creates a clear hierarchy, making it easier to scan and parse the information quickly. Later in this post, we will see lines of information without the three spaces, inserted to provide additional information.
Alongside each method in the call stack, the stack trace often includes source information:
in C:\projects\ConsoleApp\Program.cs:line 20
This information is a huge help when debugging because it points directly to the code that caused the exception. Having the exact file and line number allows you to quickly locate and inspect the source file causing an error. In the example above, the path includes my local machine, while code built on Azure DevOps, GitHub, or similar, will include the path from the checkout on the server. Previous versions of .NET required you to manually enable filename and line numbers when on a Release build (see how here) but newer versions include this automatically.
This was an example of a simple stack trace. In the following sections, I will go through various features and formats, found in .NET stack traces.
Inner exceptions
When diagnosing issues in a .NET application, the root cause of an error is sometimes not immediately visible from the outermost exception in a stack trace. Especially, if a developer catches an exception somewhere in the code and throws a new one without any context. Inner exceptions provide crucial additional context by encapsulating the original error that led to the outer exception. In my experience, understanding inner exceptions has been crucial for diagnosing some of the trickiest errors. I won't go into much detail about inner exceptions in this post and when to use them. There are already many blog posts and help articles for that purpose out there.
In short, inner exceptions are exceptions that is caught and then wrapped inside another exception. This typically occurs when an error arises, and rather than allowing it to propagate directly, the code catches the error, processes it, and throws a new exception that includes the original exception as an inner exception:
try
{
    // Call some code causing a NullReferenceException
}
catch (NullReferenceException e)
{
    throw new ApplicationException("An error happened", e);
}
The inner exception mechanism in .NET is implemented using the InnerException property. When an exception is thrown, this property can hold a reference to the original exception that triggered the error, forming a chain that connects multiple exceptions together. This chain helps trace back to the original issue, which is often the true source of the problem.
Let's look at a stack trace that includes an inner exception to understand how to interpret it:
System.ApplicationException: outer
 ---> System.FormatException: inner
   at ConsoleApp.C.Z() in C:\projects\ConsoleApp\Program.cs:line 54
   at ConsoleApp.B.Y() in C:\projects\ConsoleApp\Program.cs:line 35
   --- End of inner exception stack trace ---
   at ConsoleApp.B.Y() in C:\projects\ConsoleApp\Program.cs:line 41
   at ConsoleApp.A.X() in C:\projects\ConsoleApp\Program.cs:line 24
   at ConsoleApp.Program.Main(String[] args) in C:\projects\ConsoleApp\Program.cs:line 11
In this stack trace, we see both an outer exception (System.ApplicationException) and an inner exception (System.FormatException). Here's how to break it down:
System.ApplicationException is the outermost exception, indicating that a ApplicationException was thrown.
---> introduces the inner exception: System.FormatException. This tells us that the outer exception was caused by an earlier exception, the FormatException. The inner exception happened first, caught within method Z, and then it got wrapped into the outer ApplicationException before being rethrown. Notice how the line starting with ---> only includes a single space in front to distinguish it from frames.
The line --- End of inner exception stack trace --- marks where the stack trace of the inner exception ends and where the outer exception's trace resumes. This separator clearly distinguishes between the context of the original error and the actions that followed it.
TBH, I've always had a bit of trouble reading stack traces with inner exceptions. Not sure why, since the End of inner... message shows when the inner exception's stack trace ends. An important thing to remember when trying to understand stack traces is that the inner pieces of information are always displayed on the top. So, like the method closest to the error is shown first, the inner exception is also shown first. Multiple levels of inner exceptions make it even harder, though.
Aggregated stack traces
In .NET, an AggregateException is a special type of exception that can encapsulate multiple exceptions thrown during the execution of a program, particularly in scenarios involving parallel or asynchronous operations. You can see it as a form of exception having multiple inner exceptions. Understanding how to read and interpret the stack trace of an AggregateException is essential for diagnosing complex error scenarios where multiple failures may occur simultaneously.
An AggregateException is often seen in tasks or parallel operations where multiple errors might occur concurrently. Instead of throwing separate exceptions for each error, .NET aggregates these exceptions into a single exception. This allows us to catch a single exception and then inspect all the underlying exceptions that contributed to the failure.
Let's examine a typical stack trace from an AggregateException:
System.AggregateException: One or more errors occurred. (One of the identified items was in an invalid format.) (Object reference not set to an instance of an object.)
 ---> System.FormatException: One of the identified items was in an invalid format.
   at ConsoleApp.A.X() in C:\projects\ConsoleApp\A.cs:line 13
   at Program.<Main>$(String[] args) in C:\projects\ConsoleApp\Program.cs:line 9
   --- End of inner exception stack trace ---
 ---> (Inner Exception #1) System.NullReferenceException: Object reference not set to an instance of an object.
   at ConsoleApp.B.Y() in C:\projects\ConsoleApp\A.cs:line 21
   at Program.<Main>$(String[] args) in C:\projects\ConsoleApp\Program.cs:line 18<---
This is the same example as from before but with two causes/inner exceptions. This stack trace really shows how AggregateException handles multiple errors at once. Let's break it down.
The first line of the stack trace provides a summary of the AggregateException as we've already seen in the simple stack trace:
System.AggregateException: One or more errors occurred. (One of the identified items was in an invalid format.) (Object reference not set to an instance of an object.)
Notice how the message in this case contains both a general message as well as the messages for each underlying exception, wrapped inside parenthesis. Each of these messages is repeated in the section representing each aggregated exception as we will see in a bit.
After the overview, the stack trace breaks down each inner exception individually. Each section corresponds to what we've already seen for inner exceptions, except we can now have more than one.
Flattened stack traces
Unlike stack traces from exceptions with one or more inner exceptions, you may encounter traces with what's called flattened stack traces. In modern .NET applications, particularly those that involve asynchronous programming, it's common to encounter stack traces that might look more complex, as they can include breaks and resumptions across different sections of code. Understanding how to interpret these combined stack traces is essential for diagnosing issues effectively.
Like in the previous sections, let's look at an example:
Azure.Messaging.ServiceBus.ServiceBusException: The lock supplied is invalid. Either the lock expired, or the message has already been removed from the queue, or was received by a different receiver instance. (MessageLockLost). For troubleshooting information, see https://aka.ms/azsdk/net/servicebus/exceptions/troubleshoot.
   at Azure.Messaging.ServiceBus.Amqp.AmqpReceiver.ThrowLockLostException()
   at Azure.Messaging.ServiceBus.Amqp.AmqpReceiver.DisposeMessageAsync(Guid lockToken, Outcome outcome, TimeSpan timeout)
   at Azure.Messaging.ServiceBus.Amqp.AmqpReceiver.CompleteInternalAsync(Guid lockToken, TimeSpan timeout)
   at Azure.Messaging.ServiceBus.Amqp.AmqpReceiver.<>c.<<CompleteAsync>b__43_0>d.MoveNext()
--- End of stack trace from previous location ---
   at Azure.Messaging.ServiceBus.ServiceBusRetryPolicy.<>c__22`1.<<RunOperation>b__22_0>d.MoveNext()
--- End of stack trace from previous location ---
   at Azure.Messaging.ServiceBus.ServiceBusRetryPolicy.RunOperation[T1,TResult](Func`4 operation, T1 t1, TransportConnectionScope scope, CancellationToken cancellationToken, Boolean logRetriesAsVerbose)
   at Azure.Messaging.ServiceBus.ServiceBusRetryPolicy.RunOperation[T1](Func`4 operation, T1 t1, TransportConnectionScope scope, CancellationToken cancellationToken)
   at Azure.Messaging.ServiceBus.Amqp.AmqpReceiver.CompleteAsync(Guid lockToken, CancellationToken cancellationToken)
   at Azure.Messaging.ServiceBus.ServiceBusReceiver.CompleteMessageAsync(ServiceBusReceivedMessage message, CancellationToken cancellationToken)
   at Azure.Messaging.ServiceBus.ReceiverManager.ProcessOneMessage(ServiceBusReceivedMessage triggerMessage, CancellationToken cancellationToken)
--- End of stack trace from previous location ---. These breaks indicate boundaries in the code execution flow, often due to asynchronous programming or rethrown exceptions.
The separator signals that the stack trace has crossed a boundary, such as an await point in asynchronous code or a rethrow after an exception is caught. Understanding this can help you trace the flow of your application more accurately and diagnose issues that span multiple contexts. The separator is usually caused by one of the following scenarios:
- Asynchronous Code (
async/await):- When using
asyncandawait, the method's execution can be paused and resumed, resulting in disjointed stack traces. Each time execution is resumed after anawait, a new section of the stack trace is generated. - For example, in the example above, the trace shows breaks and resumptions as the asynchronous operations proceed, reflecting the execution flow between
awaitpoints.
- When using
- Exception Rethrowing:
- When an exception is caught and rethrown, it's possible to lose the original stack trace unless it's explicitly preserved. However, .NET provides a mechanism to retain the original stack trace using
ExceptionDispatchInfo.Capture()andExceptionDispatchInfo.Throw(). - This method usually helps keep track of where the error originally happened and where it got rethrown, although in some cases, it might still be tricky to follow.
- When an exception is caught and rethrown, it's possible to lose the original stack trace unless it's explicitly preserved. However, .NET provides a mechanism to retain the original stack trace using
- Cross-Domain or Context Boundaries:
- In some applications, exceptions might cross different execution contexts or domains (e.g., from a background task to the main UI thread). This can lead to stack traces that reflect these transitions, with each part of the stack trace representing a different execution flow.
Combined stack traces
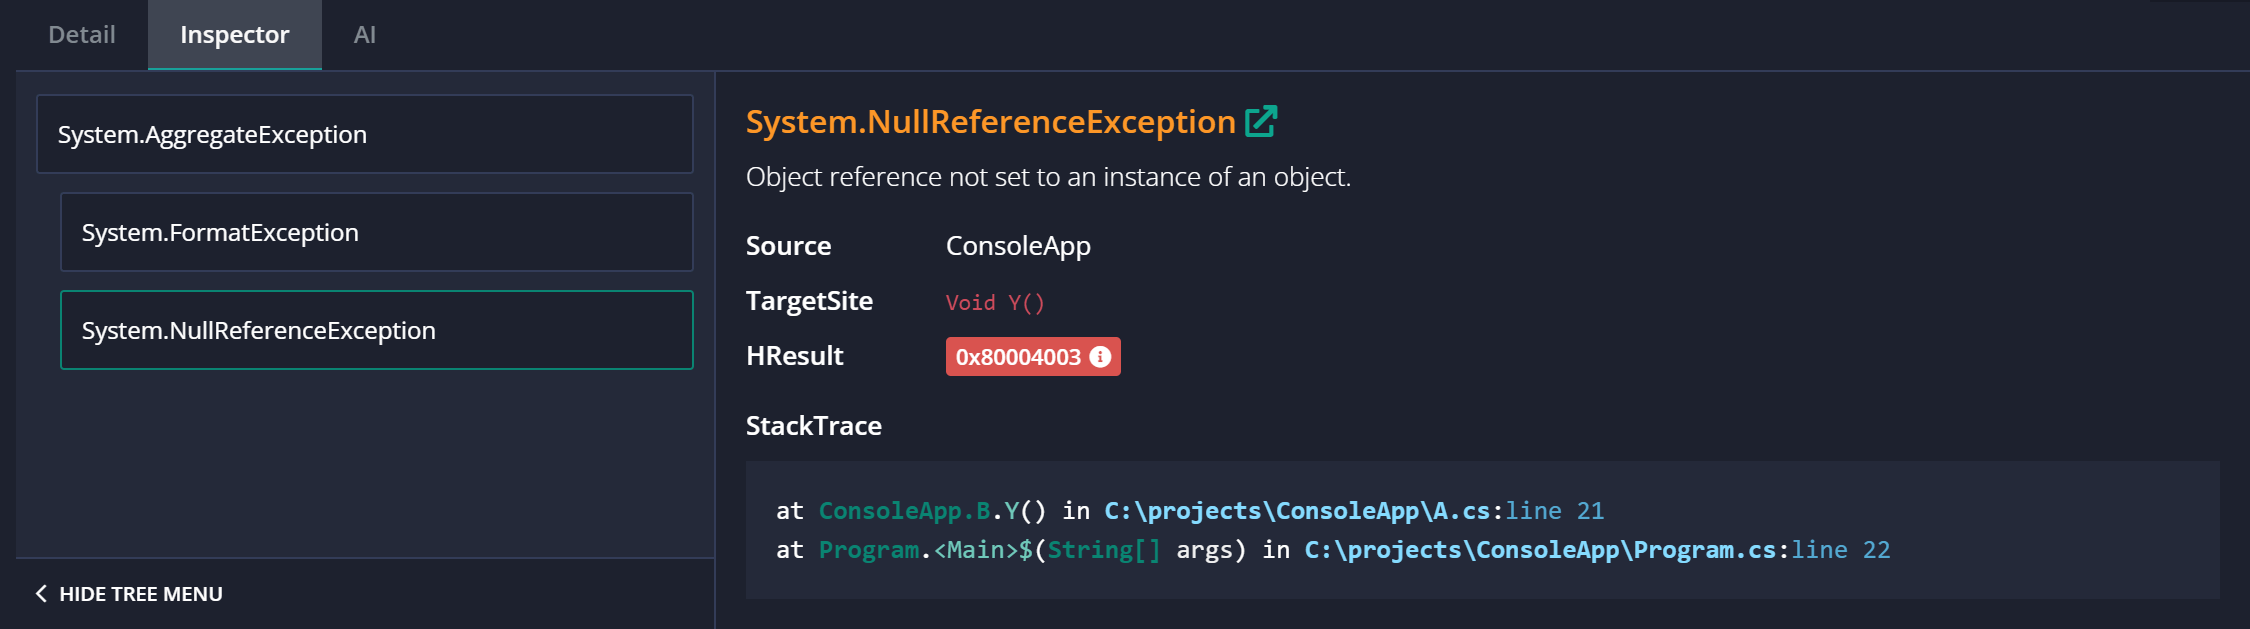
Now that we have seen examples of different formats for stack traces, let's talk about combinations. Since stack traces are typically formatted outputs of exceptions, the various formats can be combined in hundreds of ways, making the stack trace even harder to read. I mean, take a look at the following stack trace:
System.AggregateException: One or more errors occurred. (One of the identified items was in an invalid format.) (Object reference not set to an instance of an object.)
 ---> System.FormatException: One of the identified items was in an invalid format.
   at ConsoleApp.A.X() in C:\projects\ConsoleApp\A.cs:line 13
   at Program.<>c.<<Main>$>b__0_0() in C:\projects\ConsoleApp\Program.cs:line 12
   at Program.<<Main>$>g__CaptureException|0_1(Action action) in C:\projects\ConsoleApp\Program.cs:line 45
--- End of stack trace from previous location ---
   at Program.<Main>$(String[] args) in C:\projects\ConsoleApp\Program.cs:line 11
   --- End of inner exception stack trace ---
 ---> (Inner Exception #1) System.NullReferenceException: Object reference not set to an instance of an object.
   at ConsoleApp.B.Y() in C:\projects\ConsoleApp\A.cs:line 21
   at Program.<Main>$(String[] args) in C:\projects\ConsoleApp\Program.cs:line 22<---
Honestly, without a good visualizer, this stack trace feels like trying to read ancient hieroglyphics! As an example of what can be done using a proper UI, we have tried to build a better visualizer for this inside of elmah.io. This is the same stack trace in the Inspector:
Common pitfalls in stack traces
Besides the various types of stack traces presented in this post, there are a set of pitfalls that I have both experienced myself and heard other developers ask about.
- Sometimes, methods might be inlined or optimized away by the compiler, making the stack trace less complete than expected. I've seen various use of attributes like
[MethodImpl(MethodImplOptions.NoInlining)]that messes with the stack trace. - If you're working with third-party libraries or obfuscated code, the stack trace may not clearly show method names or source lines, complicating the debugging process. You have probably seen filename and method names similar to what I showed in the first examples from obfuscated libraries (
X,Y, etc.). - As already mentioned earlier in this post, release builds might lack detailed source information (like file paths and line numbers) unless debugging symbols (.pdb files) are available. Luckily, this seems to have been fixed in new versions of .NET.
elmah.io: Error logging and Uptime Monitoring for your web apps
This blog post is brought to you by elmah.io. elmah.io is error logging, uptime monitoring, deployment tracking, and service heartbeats for your .NET and JavaScript applications. Stop relying on your users to notify you when something is wrong or dig through hundreds of megabytes of log files spread across servers. With elmah.io, we store all of your log messages, notify you through popular channels like email, Slack, and Microsoft Teams, and help you fix errors fast.

See how we can help you monitor your website for crashes Monitor your website