Tuning performance on Azure websites using remote profiling
When running a service like elmah.io, performance is everything. We receive a lot of requests daily and a few ms actually make a difference both in the time clients need to wait for a reply, as well as our Cloud spending. We are running a range of different performance and load tests using isolated websites on Microsoft Azure. Often, predicting how users are using your system is hard and you end up spending a lot of time creating scenarios that don’t match reality.
I wanted to look at the actual performance of our production website and API. We are using New Relic already however, we missed the old days where you would simply attach a debugger and create a sample over 10 minutes to look at. I may be the last guy in the universe to discover it, but it turns out Azure offers a built-in profiler, available through both Visual Studio and Kudu.
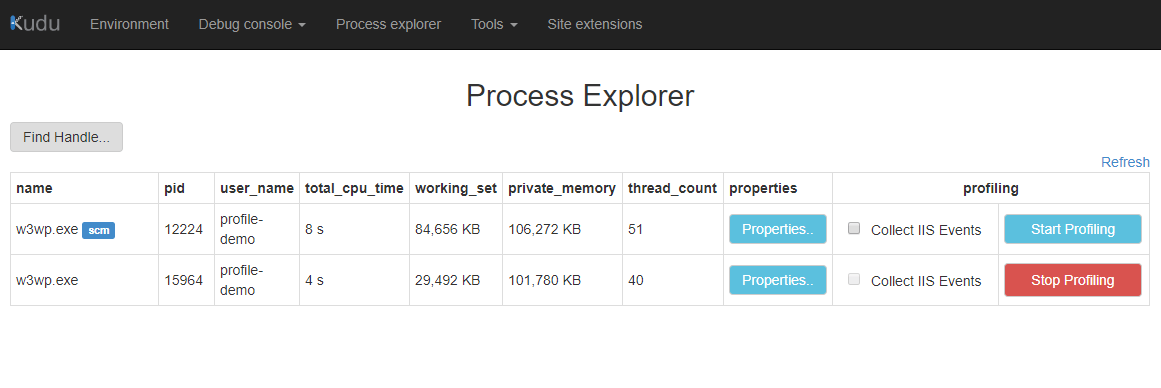
To create a sample to look at, head over to your Kudu site (located at https://yourwebsite.scm.azurewebsites.net/). Click the Process explorer menu and locate the w3wp.exe process. This is the actual process hosting your web application. To start profiling, click the Stack Profiling button:

Keep your website running for a timespan of your choice. If your website executes the same tasks over and over again (like an API), you’ll probably need less time, then when profiling a website with a lot of features. In the end, how long you want the profiler to run is something you will need to figure out yourself.
When you are happy, click the Stop Profiling button and your browser will download the result as a .diagsession file. Diagsession files are zip-files containing a trace file (*.etl) alongside some metadata. The best way to look at diagsession files, is to open them directly in Visual Studio. Since the etl contains references to the profiled website, make sure to open the diagsession file in the instance of Visual Studio where you have the profiled project loaded.
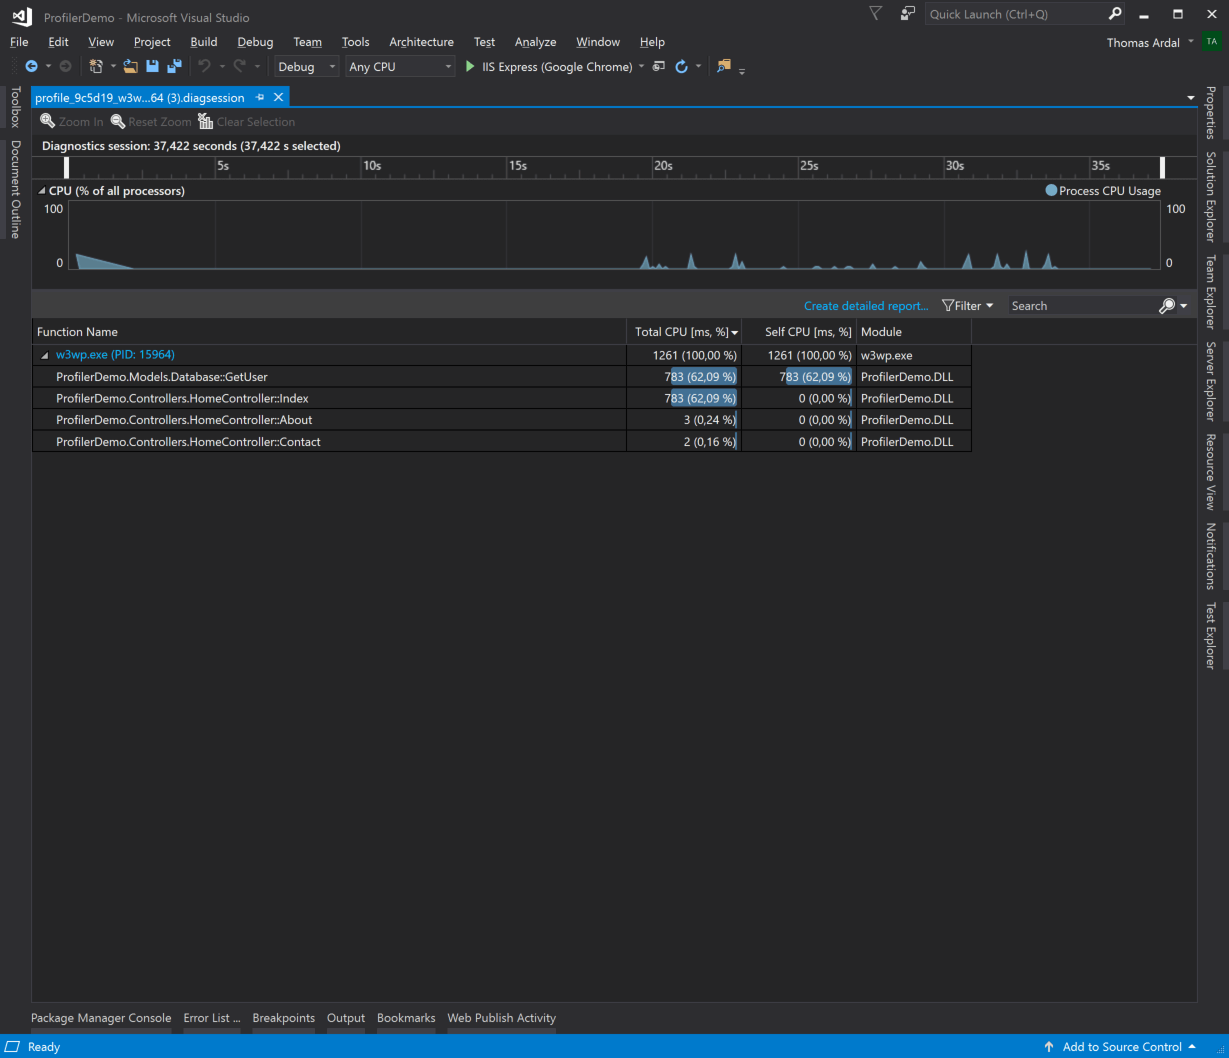
After a bit of processing, you’ll see the sample:

In the top, you’ll see the CPU usage during the profiled timespan. You can highlight a specific area by clicking on the graph and pulling the mouse either left or right.
In the bottom, there’s a list of all the invoked C# methods. The Total CPU [ms %] column shows which methods caused the most CPU time (including the time spent in methods called by the method itself). To get an overview of which endpoints caused the most CPU usage, sort by this column. The Self CPU [ms %] column shows the time spend in each method. To see which concrete methods are actually taking up CPU, order by this column.
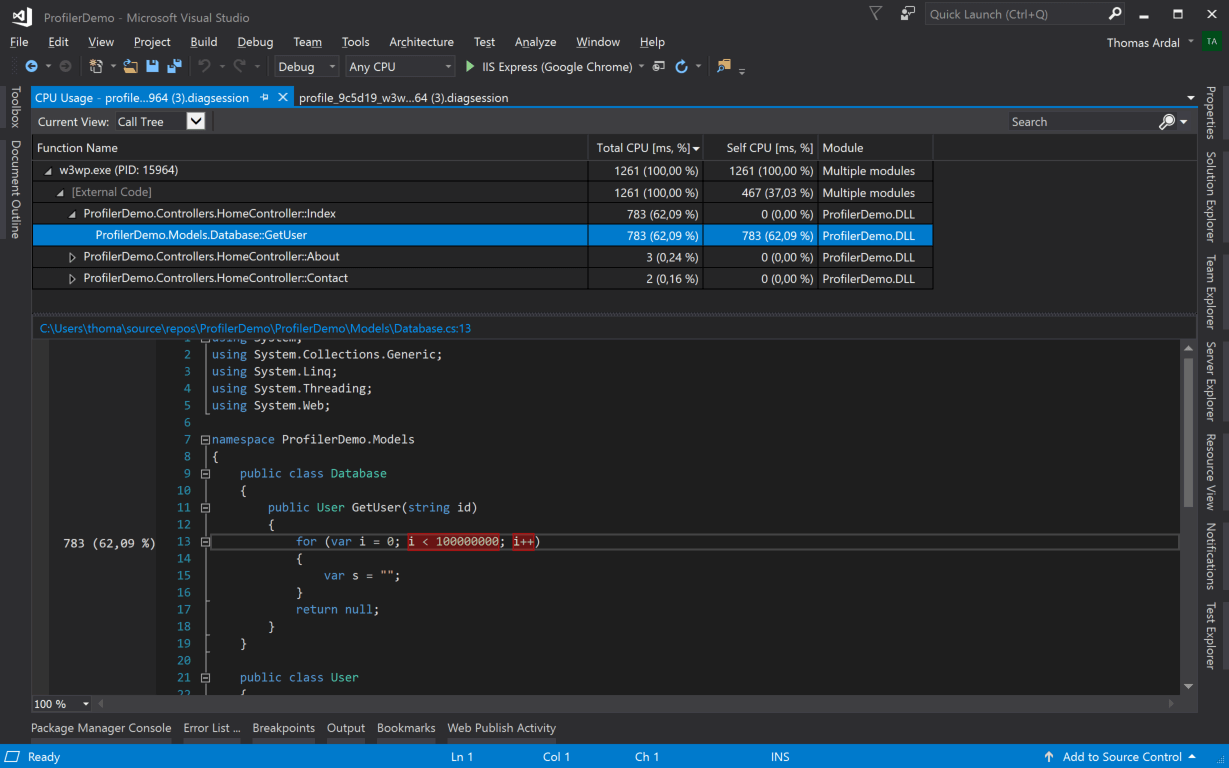
To start digging into why a method is using CPU cycles, double-click a row. This opens the details view, which IMO is sort of a weird UI. I like digging into the call stack using a tree structure, rather than the Caller/Callee UI opened as a default. Luckily, switching is easy using the dropdown in the top:

The UI now works like a classic CPU Profiler. Extending a node in the tree reveals which other methods the extended method is invoking and how much time was spent in each method. By extending down through the tree, you will most likely get to a point where the CPU time is used.
Being able to profile a running Azure web app with real data and real users hitting your system is a great way to find slow performing code. You may surprised at what you’ll find. At least we did while profiling our API. Our endpoint for creating errors in elmah.io were using a regular expression for identifying stack traces in the detail field. That specific regex turned out to require most of the CPU cycles on our API (!).
elmah.io: Error logging and Uptime Monitoring for your web apps
This blog post is brought to you by elmah.io. elmah.io is error logging, uptime monitoring, deployment tracking, and service heartbeats for your .NET and JavaScript applications. Stop relying on your users to notify you when something is wrong or dig through hundreds of megabytes of log files spread across servers. With elmah.io, we store all of your log messages, notify you through popular channels like email, Slack, and Microsoft Teams, and help you fix errors fast.
See how we can help you monitor your website for crashes Monitor your website
