
Monitoring Windows Services implemented in .NET
To monitor a Windows Service, you can use the Service Control Manager (SCM) that is built into Windows. SCM allows you to view and manage the services on a local or remote computer, including starting and stopping services, and viewing their current status.
To access the SCM, you can use the services.msc command in the Run dialog (press the Windows key + R to open the Run dialog, then enter services.msc and press Enter). This will open the Services snap-in, which allows you to view and manage the services on the local computer.
To monitor a specific service, you can search for it by name in the Services snap-in, and then do the following steps:
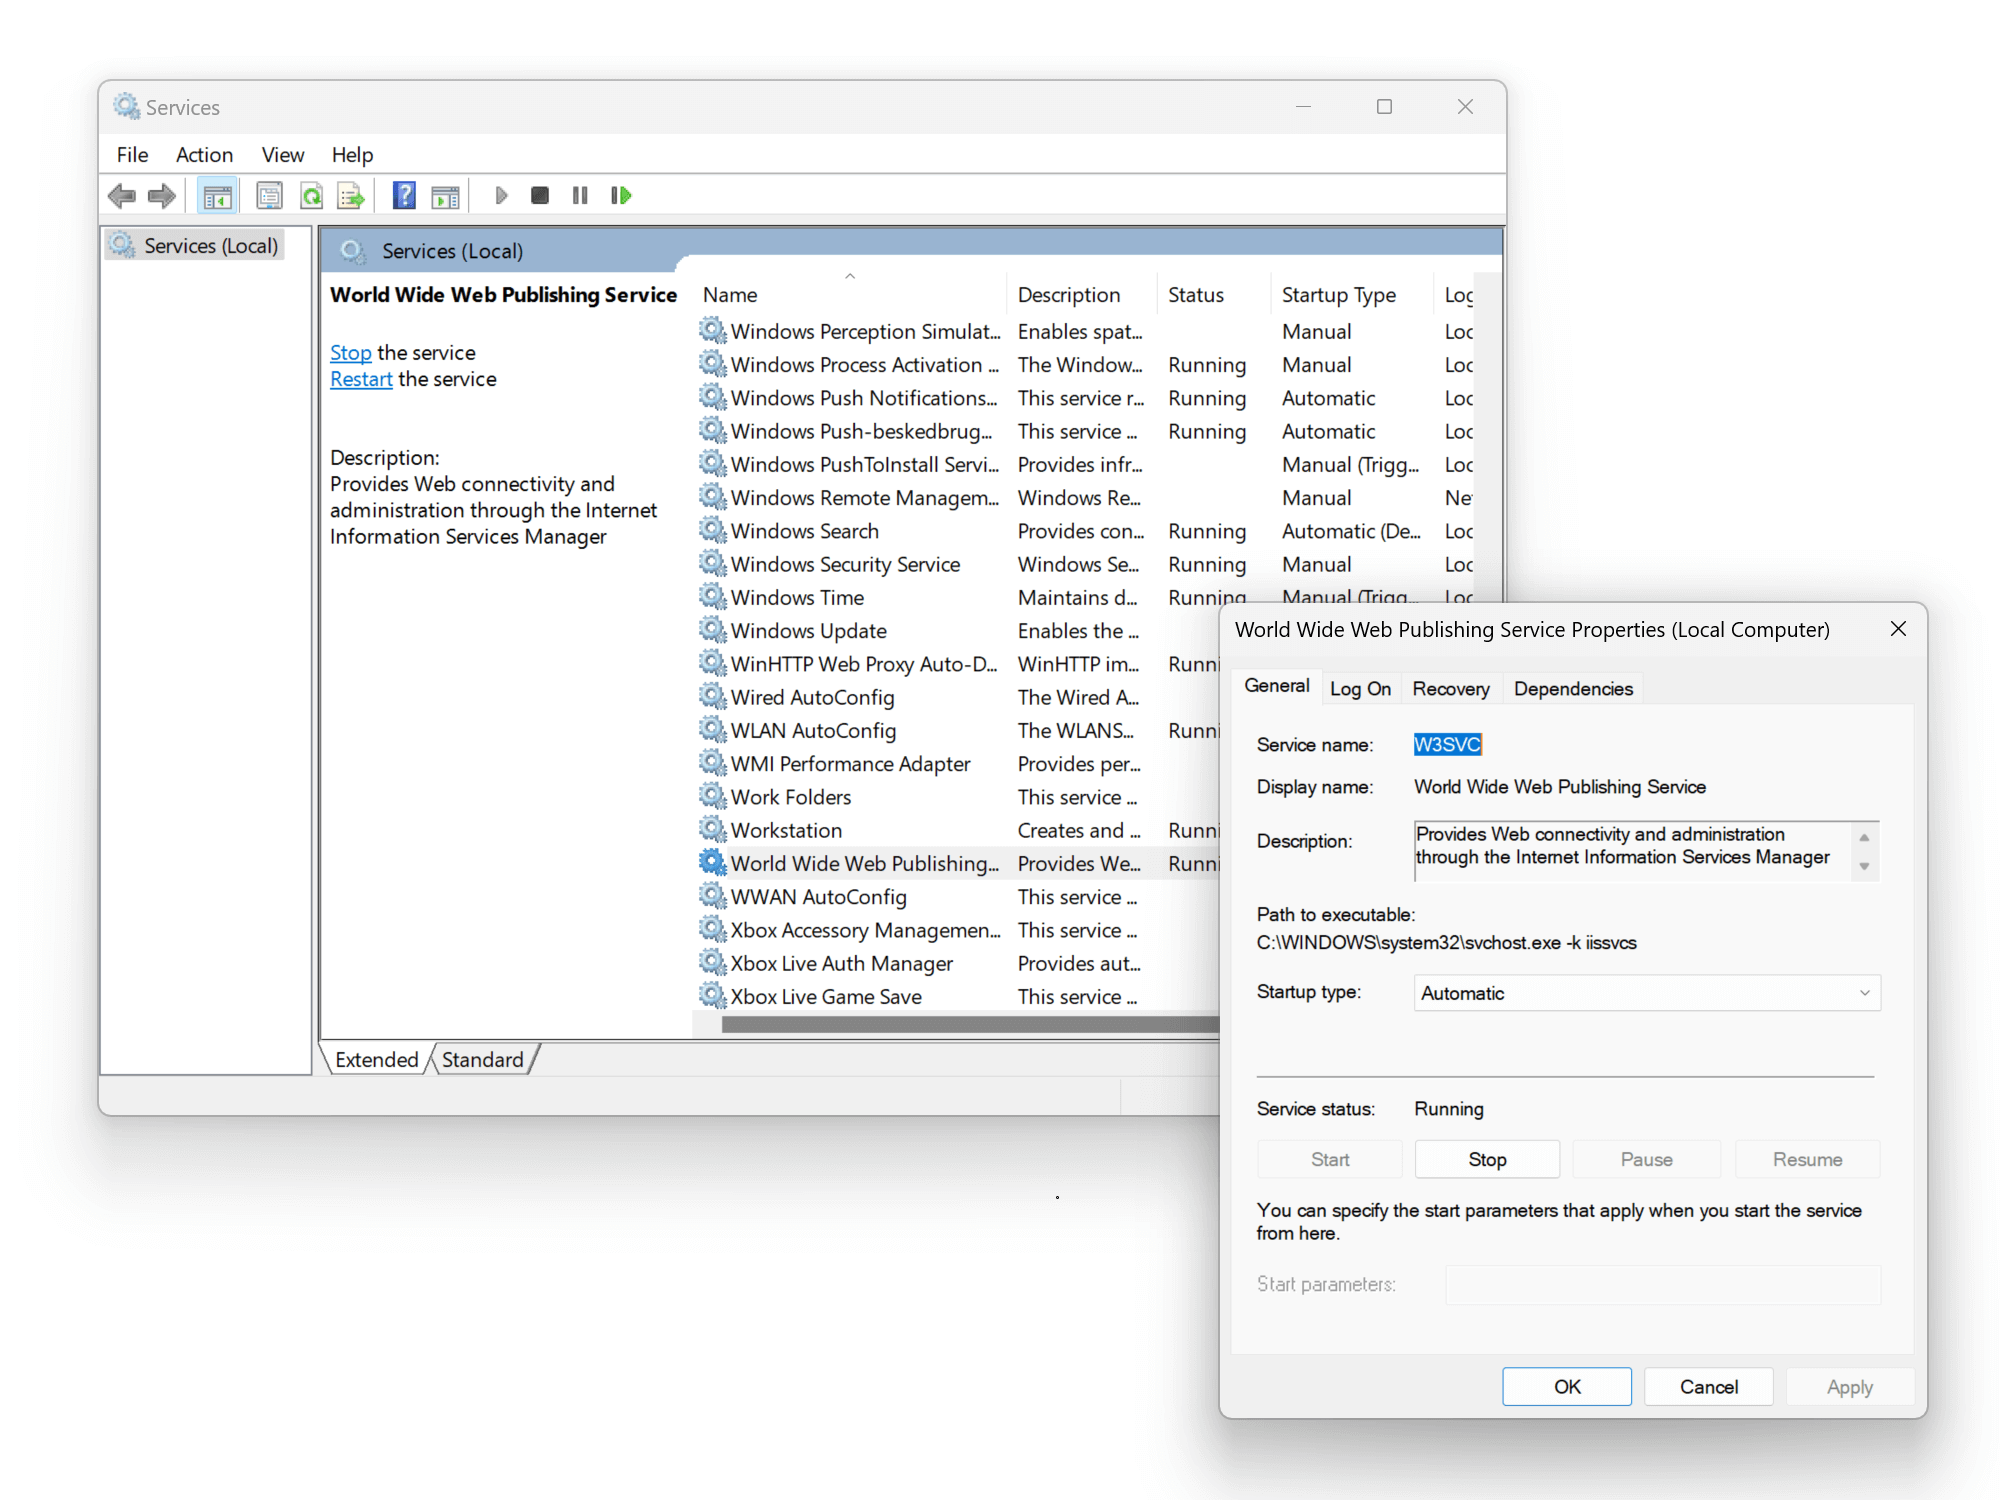
- In Services, right-click on the service you want to monitor and select Properties from the context menu.
- In the Properties window for the service, go to the General tab.
- In the Service status section, inspect the current status of the service (e.g., Running, Stopped, etc.). Missing results from a service can be caused by something as simple as a stopped service.
- In the Startup type section, it is detailed how the service is set to start when the computer starts (e.g., Automatic, Manual, Disabled, etc.). Setting a type to Manual or Disabled will require you to manually start a service after each reboot.
- In the Log on as section, you can view the account that the service is set to run under. Using an account here with missing permissions can cause various problems while running the service.
- In the Service name section, you can view the name of the service. This name is used to identify the service in the SCM and other tools. In the Description section, you can view a description of the service and what it does. The name and description are just free text and usually don't cause problems while executing the service.
In addition to viewing the properties of a service, you can also use the Services snap-in to start, stop, and restart the service, as well as change its startup type and logon account.
Another way to monitor a Windows Service is to use performance counters. Performance counters are a built-in feature of Windows that allows you to monitor various aspects of a system's performance, including the processor and memory usage of a specific service.
To access performance counters, you can use the perfmon.msc command in the Run dialog (press the Windows key + R to open the Run dialog, then enter perfmon.msc and press Enter). This will open the Performance Monitor snap-in, which allows you to view and manage performance counters.
To monitor a specific service using performance counters, you can use the following steps:
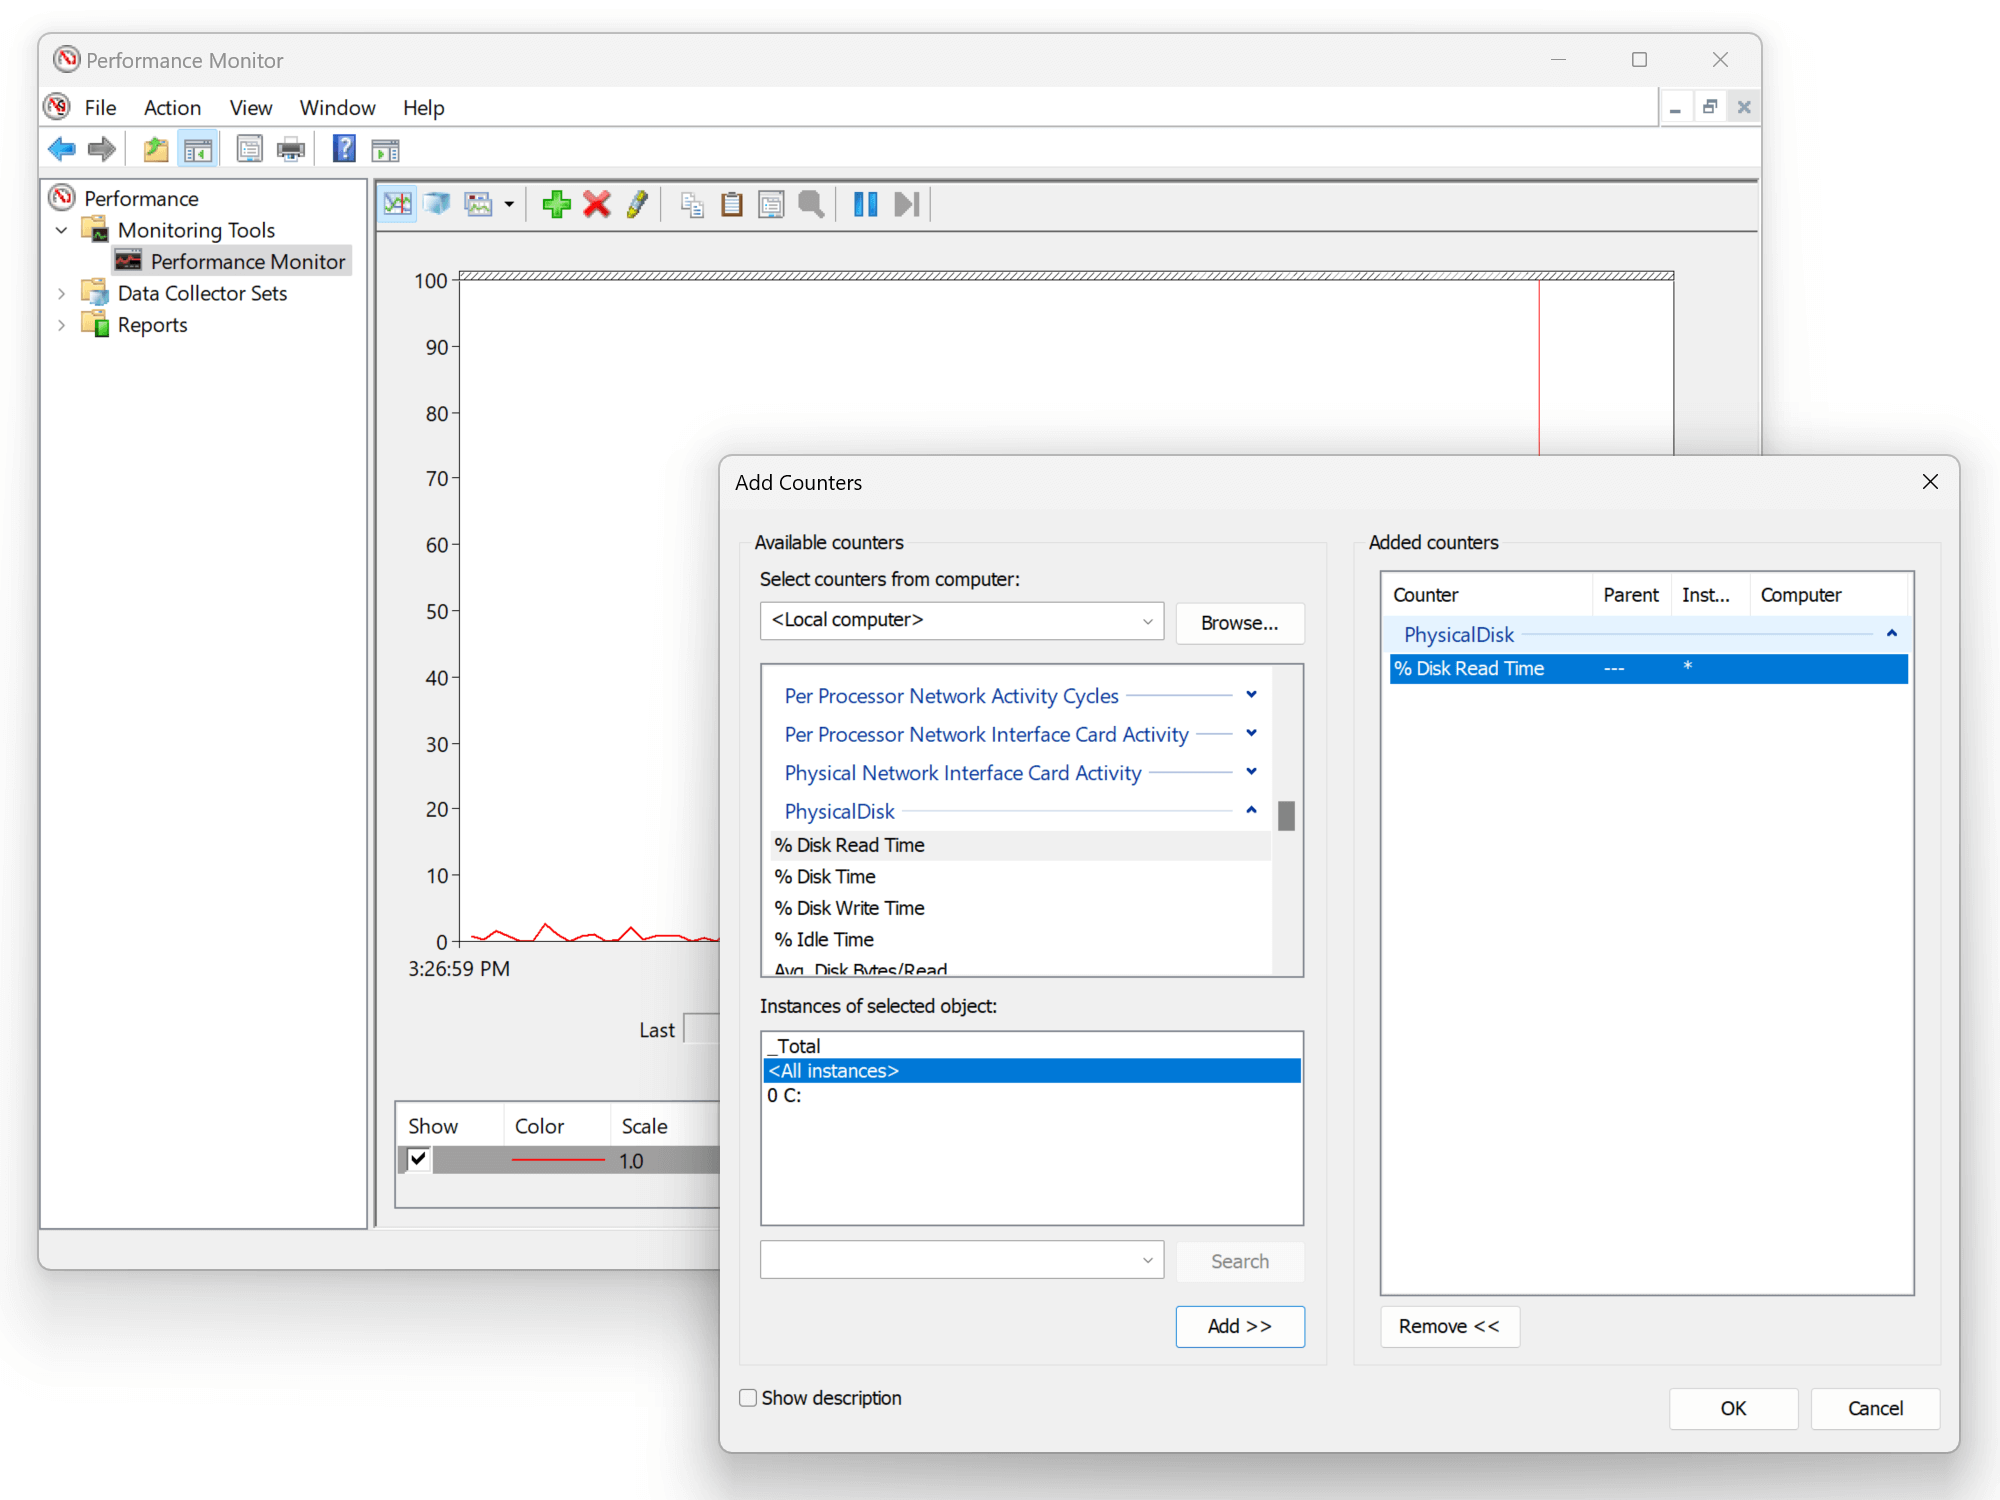
- In the Performance Monitor, click on the Add counter button.
- In the Add counters window, select the service you want to monitor from the list of available counters.
- In the Instances of selected object section, select the specific instance of the service that you want to monitor. For example, if you are monitoring the SQL Server "MSSQLSERVER" service, you might have multiple instances of the service if you have multiple versions of SQL Server installed.
- Click on the Add button to add the selected counter to the graph.
- The performance counter will now be displayed in the graph, and you can monitor its value over time to see how the service performs.
Performance Monitor is a good starting point when trying to locate memory leaks in Windows Services. Set up a performance counter of the current memory usage and inspect it over time. If it continues to grow, chances are that you have a memory leak. The garbage collector should clean up unused objects on a continuous basis, which is visible on the memory graph for most applications.
In summary, several ways to monitor Windows Services include using the Service Control Manager and performance counters. These tools allow you to view the current status of a service, start and stop the service, and monitor its performance.
elmah.io: Error logging and Uptime Monitoring for your web apps
This blog post is brought to you by elmah.io. elmah.io is error logging, uptime monitoring, deployment tracking, and service heartbeats for your .NET and JavaScript applications. Stop relying on your users to notify you when something is wrong or dig through hundreds of megabytes of log files spread across servers. With elmah.io, we store all of your log messages, notify you through popular channels like email, Slack, and Microsoft Teams, and help you fix errors fast.

See how we can help you monitor your website for crashes Monitor your website