
Introducing Client-side logging to elmah.io
Today, I'm happy to share some huge news. elmah.io is no longer limited to logging errors from your server. We now also support client-side logging through the recent addition, simply named elmah.io.javascript. With elmah.io.javascript, JavaScript errors happening right there in the users' browser, are logged to elmah.io alongside all of your server-side errors.
As always, we do most of the work for you when needing to install and configure elmah.io.javascript. With our focus on the .NET platform, we can make sure that our client-side experience matches the already high standard you know from our server-side integrations.
elmah.io.javascript can be installed in multiple ways. Examples are manual, using a CDN, using npm or NuGet, using ASP.NET Core tag helpers and even LibMan. For more info about how to install elmah.io into your project, check out Logging from JavaScript.
In short, the only thing you need to do is to reference the elmahio.js script:
<script src="~/Scripts/elmahio.js?apikey=API_KEY&logid=LOG_ID"></script>
That's it! All uncaught JavaScript errors are now logged to the specified log.
Remember to disable access to the v2 API on your log and generate a new API key with
messages_writepermission only.
Errors show up in elmah.io in the same way as server-side errors. The logged pieces of information come from the client, though:
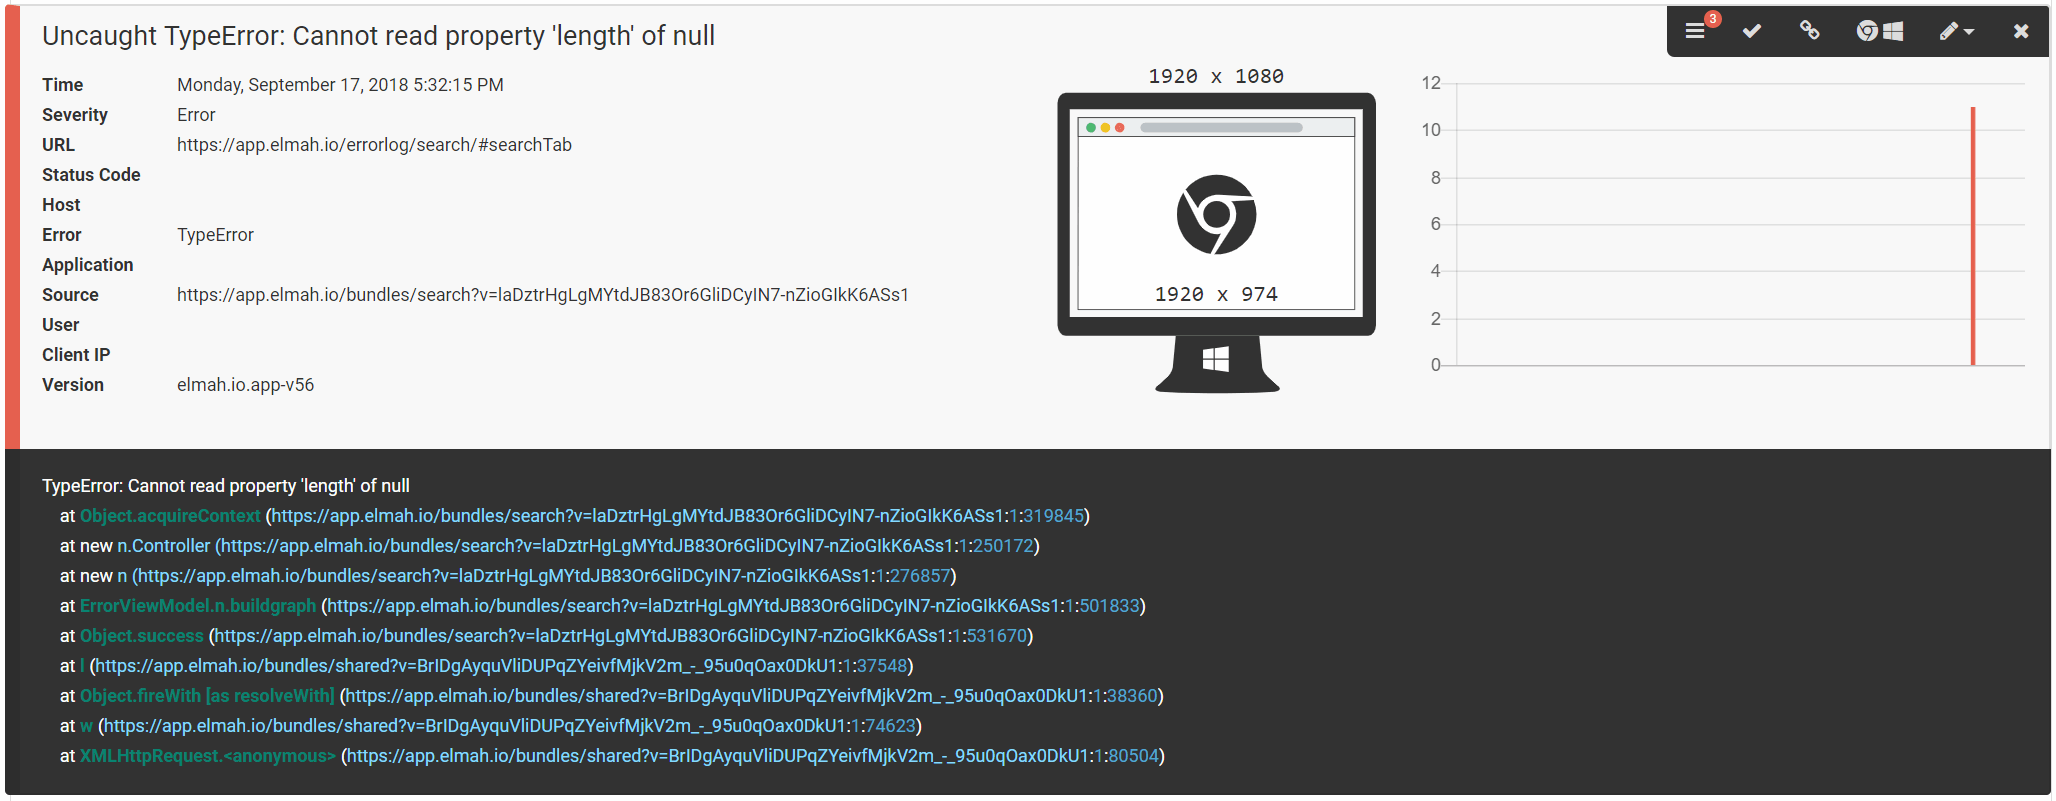
In this example, a TypeError from the browser is logged in elmah.io. Notice the extended device information available on client-side errors. When logging errors, elmah.io.js automatically collects information about the device, resolution, language and more. This information helps you spot if an error is happening on a mobile device, a single resolution or specific OS version only.
Since you are logging client-side errors to your existing error logs, all of the rules and notifications already set up, just work. Client-side errors are smart grouped just as server-side errors, making it possible for you to notify your team every time a new error is generated on the client. The built-in issue tracker also works on client-side errors.
Like our server-side integrations, errors and even information messages can be logged from the browser. elmah.io.js provides a logging API, similar to the ones you already know from log4net, Serilog and similar. Log messages can be logged manually like this:
var logger = new Elmahio({
  apiKey: 'API_KEY',
  logId: 'LOG_ID'
});

logger.information('Hello World from the browser');

try {
  throw new Error('Some error');
} catch(err) {
  logger.error('An error happened', err);
}
elmah.io.js provides a range of different options, like events. For more information, check out the documentation.
Client-side support is still in beta, but we expect everything to stabilize before the end of the year. We are currently working on:
- TypeScript mappings to provide IntelliSense in Visual Studio.
- Source mapping support, showing deminified stack traces on elmah.io.
- Finishing the documentation and samples for frameworks like Angular and React.
elmah.io: Error logging and Uptime Monitoring for your web apps
This blog post is brought to you by elmah.io. elmah.io is error logging, uptime monitoring, deployment tracking, and service heartbeats for your .NET and JavaScript applications. Stop relying on your users to notify you when something is wrong or dig through hundreds of megabytes of log files spread across servers. With elmah.io, we store all of your log messages, notify you through popular channels like email, Slack, and Microsoft Teams, and help you fix errors fast.

See how we can help you monitor your website for crashes Monitor your website