
HTTP Error 500.30 - ASP.NET Core app failed to start help
Problems during the startup of an ASP.NET Core project on your production environment can be extremely hard to debug. In this article, I'll guide you through where to look and possible solutions to common startup problems.

So, you spend days developing the next Facebook or Twitter in ASP.NET Core. Everything works out on your machine, and after deploying your site to the production environment, all you get is this error in the browser:
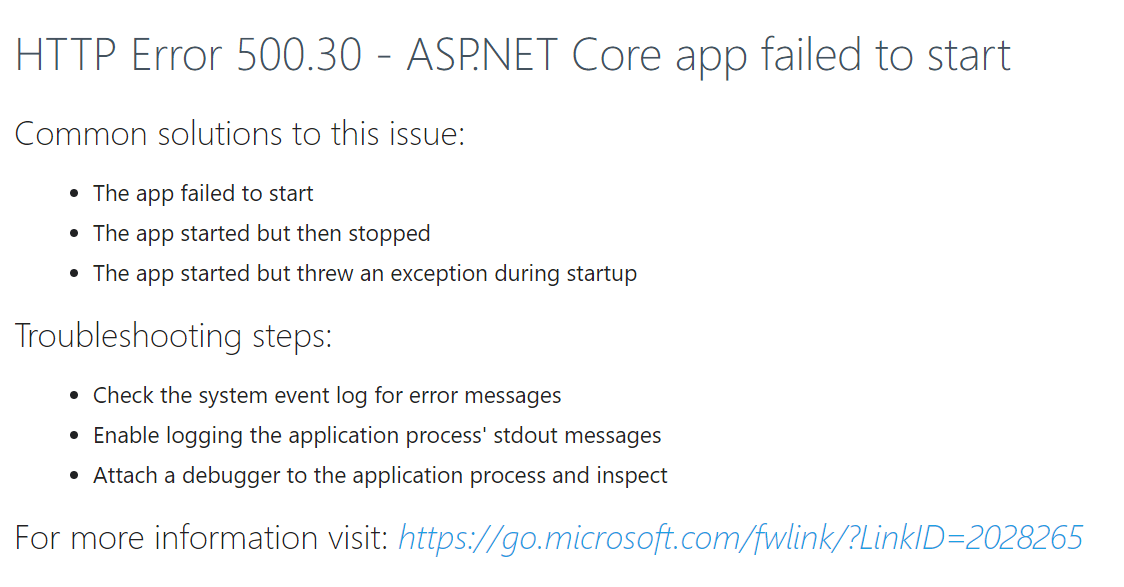
As stated in the headline, the ASP.NET Core failed to startup. This means that something happened during the initialization of your app, why you won't even be able to launch any of your web pages. This page is sometimes referred to as the White Screen of Death, a spin on the Blue Screen of Death in Windows and the Yellow Screen of Death in ASP.NET.
Here is a list of actions to run through to help to figure out what went wrong. Not all of the actions may be applicable or even possible in your case.
Enable developer exception page
This is probably the fastest way to get some more details of the error happening. When working locally and errors happen, you get a much more detailed message in the browser. This is because of a piece of middleware part of ASP.NET Core named DeveloperExceptionPage. Open the Startup.cs file and locate the call to UseDeveloperExceptionPage:
public void Configure(IApplicationBuilder app, IWebHostEnvironment env)
{
    if (env.IsDevelopment())
    {
        app.UseDeveloperExceptionPage();
    }
    else
    {
        app.UseExceptionHandler("/Home/Error");
    }

    // ...
}
This is the code as it looks when creating a new ASP.NET Core project from the default template. Yours may or may not look similar. The task here is to only use the developer exception page by replacing the code above with:
public void Configure(IApplicationBuilder app, IWebHostEnvironment env)
{
    app.UseDeveloperExceptionPage();

    // ...
}
This will show the developer exception page on both your local environment as well as production. This solution is only applicable before you get real users in your production environment. You never want to leak internal information from your application on an error page when real users (and potential hackers) can access your site. Also, remember to switch back to the previous code once you have found the cause of the error.
Enable logging
Depending on how far ASP.NET Core has gotten before breaking down, you may be in luck, and the error is logged as part of Microsoft.Extensions.Logging. To enable logging from your website, start by opening the Program.cs file and call the ConfigureLogging method like this:
public static IHostBuilder CreateHostBuilder(string[] args) =>
    Host.CreateDefaultBuilder(args)
        .ConfigureWebHostDefaults(webBuilder =>
        {
            webBuilder.UseStartup<Startup>();
            webBuilder.ConfigureLogging((ctx, logging) =>
            {
            });
        });
Next, you will need to choose a destination for the log messages generated by ASP.NET Core. Since the error is happening on a remote web server, you will need some kind of persistent storage like a file, a database, a cloud logging service (like elmah.io), or similar. Let's start with logging to the Windows Event Log by including the following code inside the action provided for the ConfigureLogging method:
logging.AddEventLog(options =>
{
    options.SourceName = "MyApp";
});
This will log all warnings and up to the Application log with a Source named MyApp. You can filter events using that source through the Event Viewer application in Windows.
In case you are hosting on Linux or Mac, the event log solution won't be available. There, you will need to find an alternative (like a database). Microsoft.Extensions.Logging supports a range of logging targets either natively or through third-party packages available on NuGet.
I quickly want to mention the elmah.io integration for Microsoft.Extensions.Logging. Setting up logging only requires a few lines of code inside the ConfigureLogging method:
logging.AddElmahIo(options =>
{
    options.ApiKey = "API_KEY";
    options.LogId = new Guid("LOG_ID");
});
Once you have signed up for elmah.io, the real values to use instead of API_KEY and LOG_ID will be available through the elmah.io UI.
In some cases, problems occur before initializing the logging framework. ASP.NET Core provides some simple file logging through the web.config file. To enable file logging, add the following to your web.config file:
<system.webServer>
  <aspNetCore /* ... */ stdoutLogEnabled="true" stdoutLogFile=".\logs\stdout" />
</system.webServer>
This will create a log file named stdout followed by a rolling id in a logs folder in the root of the project. If the file is empty after running the failing endpoint, you can enable additional debug logging like this:
<system.webServer>
  <aspNetCore /* ... */>
    <handlerSettings>
      <handlerSetting name="debugFile" value=".\logs\aspnetcore-debug.log" />
      <handlerSetting name="debugLevel" value="FILE,TRACE" />
    </handlerSettings>
  </aspNetCore>
</system.webServer>
This will create a file named aspnetcore-debug.log in the same folder as explained above. For both the stdout and the aspnetcore-debug.log file, this is recommended for debugging problems on localhost only. In other words, don't enable this in your production environment.
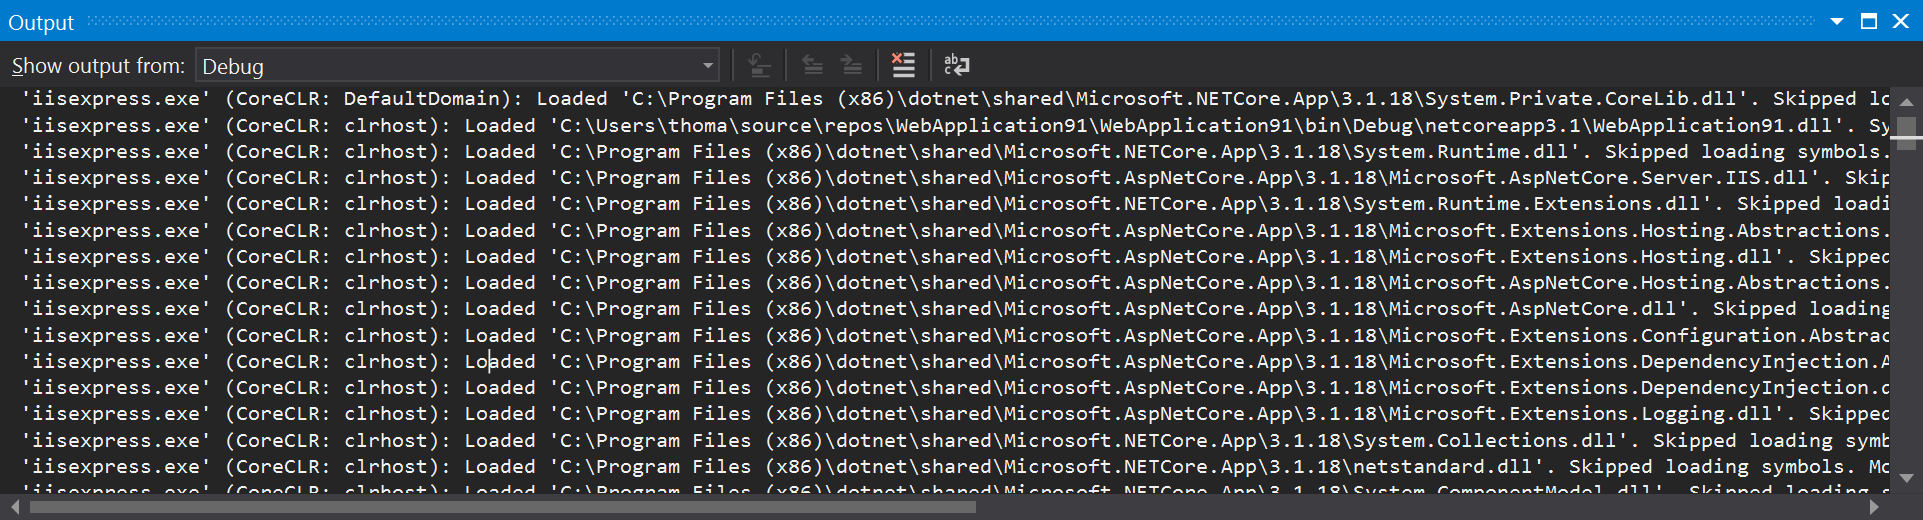
When running the site on your local machine, detailed log output similar to the debug log file specified above is available in the Output window inside Visual Studio. Make sure to select Debug in the Show output from the drop-down:
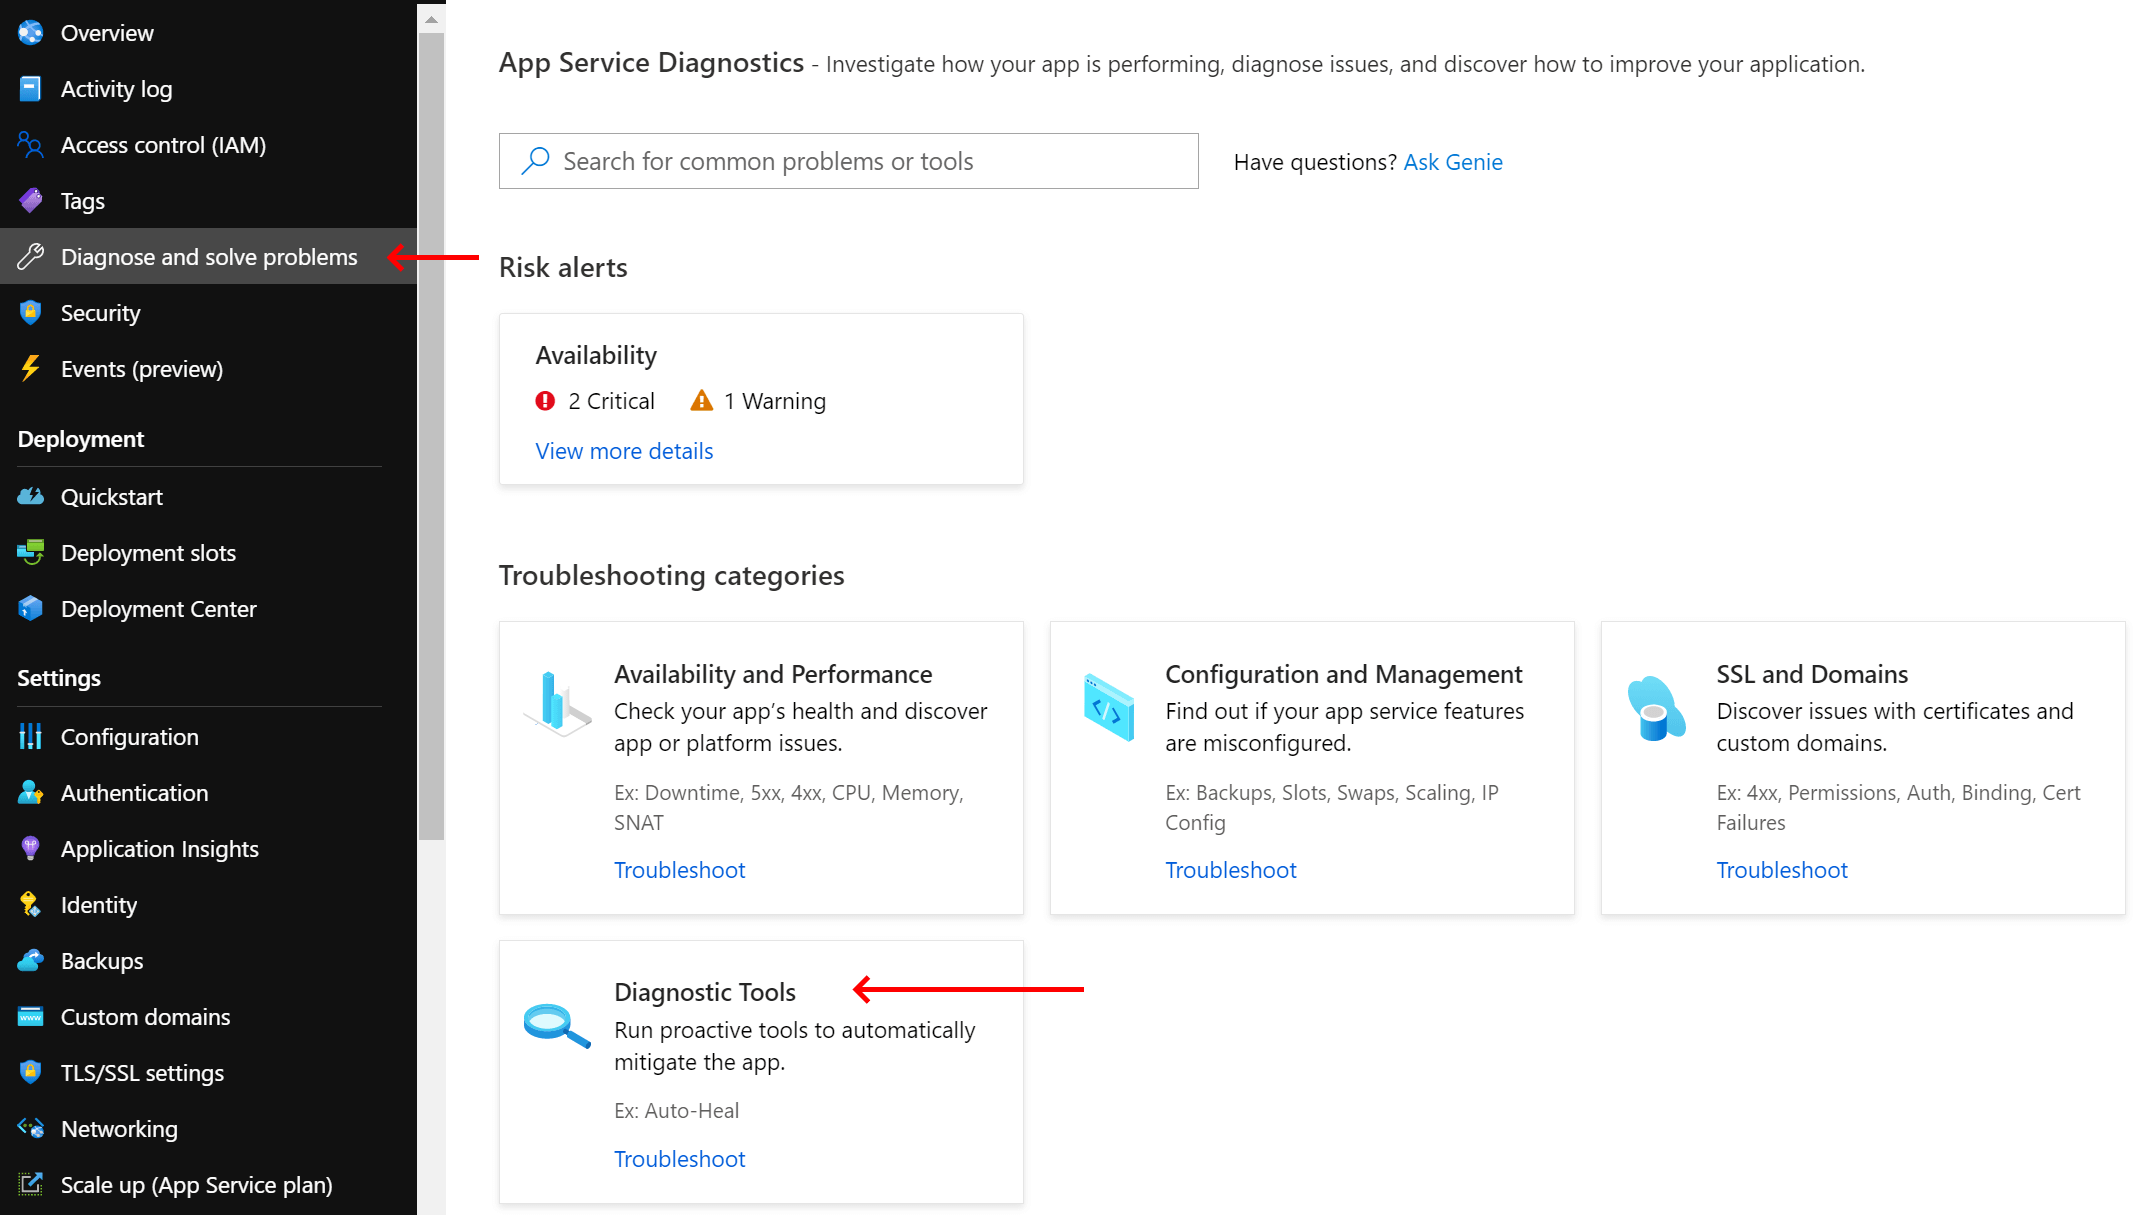
If running on Microsoft Azure, something similar can be viewed in the Application Event Logs tool available here:
Remote debug the application
ASP.NET Core supports remote debugging, meaning that you can attach a debugger running on your developer machine to the site running on the production environment.
To debug a remote site, you will need to carry out the following steps:
- Download the Remote tools matching your Visual Studio version here: https://learn.microsoft.com/en-us/visualstudio/debugger/remote-debugging-aspnet-on-a-remote-iis-computer?view=visualstudio.
- Install Remote tools on the server running the web server.
- Make sure to either disable the firewall on the web server or allow incoming connections on port
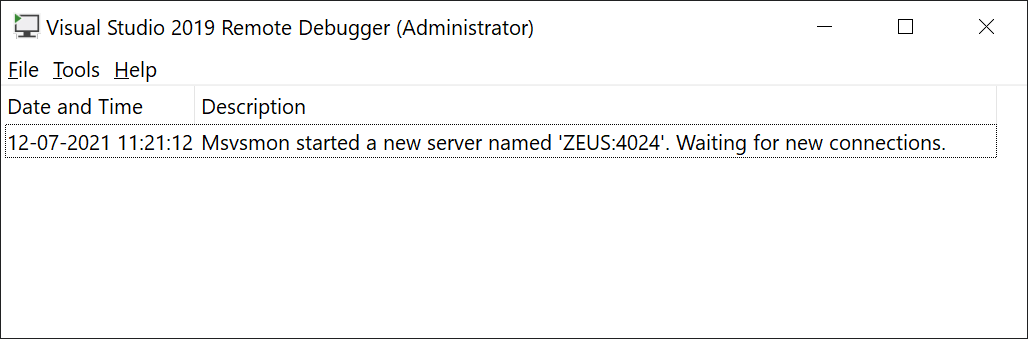
4024. - Launch Remote Debugger as Administrator (👈 important).
- Launch the website in Visual Studio on your developer machine and select Debug | Attach to process.
- Fill in the form like this, but replace the hostname with the name of the server running the web server:
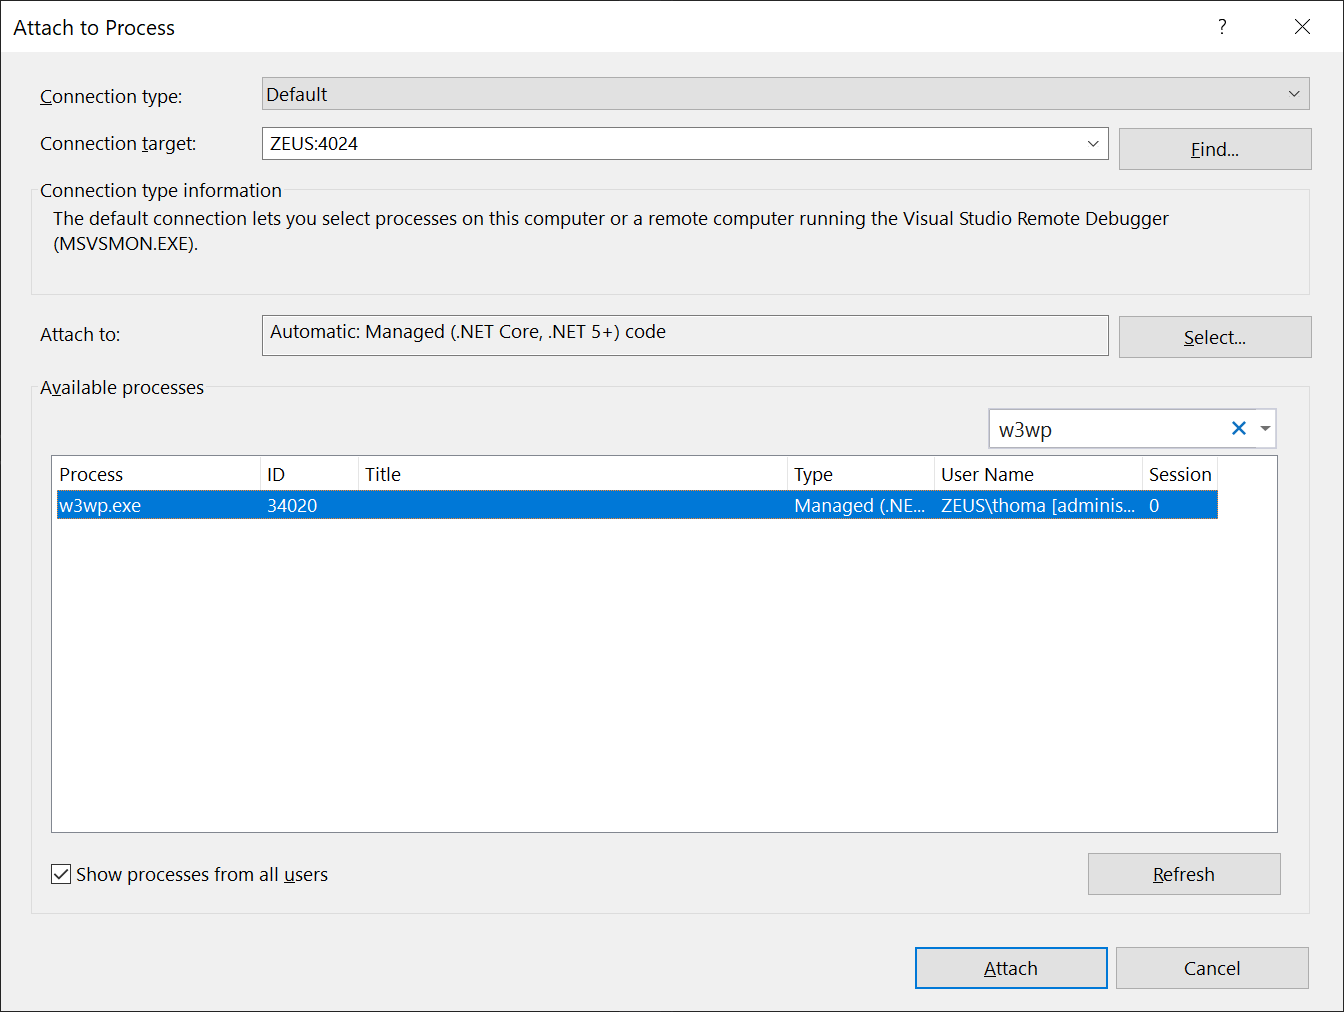
- Click the Attach button to debug the remote application.
This was just a quick walkthrough. For the full documentation, check out Microsoft's documentation here: https://learn.microsoft.com/en-us/visualstudio/debugger/remote-debugging-aspnet-on-a-remote-iis-computer?view=visualstudio.
Validate the appsettings.*.json files
A common problem with starting ASP.NET Core is an invalid appsettings.json and/or appsettings.Production.json. It could be either a JSON syntax problem, a problem with the content within the config file, or a problem when transforming values from the appsettings.Production.json file into appsettings.json.
I will recommend that you grab both the appsettings.json and appsettings.Production.json (if any) files from the server and do the following for both files:
- Validate the JSON with this JSON Formatter and Validator.
- Validate the content of the JSON file with this Appsettings.json Validator.
Also, make sure to verify that the changes in the appsettings.Production.json file look correct using this Appsettings.json Transformation Tester.
elmah.io: Error logging and Uptime Monitoring for your web apps
This blog post is brought to you by elmah.io. elmah.io is error logging, uptime monitoring, deployment tracking, and service heartbeats for your .NET and JavaScript applications. Stop relying on your users to notify you when something is wrong or dig through hundreds of megabytes of log files spread across servers. With elmah.io, we store all of your log messages, notify you through popular channels like email, Slack, and Microsoft Teams, and help you fix errors fast.

See how we can help you monitor your website for crashes Monitor your website