How to run code coverage of .NET code on Azure DevOps
I have a love/hate relationship with measuring code coverage on unit tests. When done right, it can be a powerful and helpful tool. I've experienced successful implementations and disasters (more about that in the last part). In this post, I'll show how you can perform and output code coverage metrics when running unit tests on Azure DevOps.

To make sure everyone will follow, let's start by taking a look at what code coverage is. When writing unit tests (or all types of tests, really), you want to make sure that the tests actually cover the code lines under test. That's where you can use code coverage to measure and inspect what lines are tested. Code coverage only tells you whether a line of code has been executed, not if it was tested correctly. You can write a test that produces code coverage of 100% without a single assert and without testing that the code works. That's why code coverage should be used as a tool to help write good tests and not with a specific percentage in mind.
Let's use some code as an example for adding code coverage automatically on Azure DevOps builds. The content of the code is not really important for this post, so I've asked ChatGPT to generate a helpful string method and some tests:
public static class StringExtensions
{
    public static int CountWordsStartingWithCapital(this string input)
    {
        if (string.IsNullOrWhiteSpace(input))
            return 0;

        var words = input.Split(' ', StringSplitOptions.RemoveEmptyEntries);
        return words.Count(word => char.IsUpper(word[0]));
    }
}
public class StringExtensionsTest
{
    [Test]
    public void ReturnsZero_WhenNoWordsStartWithCapital()
    {
        string input = "this is a test string";
        var result = input.CountWordsStartingWithCapital();
        Assert.That(result, Is.EqualTo(0));
    }

    [Test]
    public void ReturnsCorrectCount_WhenSomeWordsStartWithCapital()
    {
        string input = "This is A test String";
        var result = input.CountWordsStartingWithCapital();
        Assert.That(result, Is.EqualTo(3));
    }

    [Test]
    public void IgnoresEmptyWords_WhenMultipleSpaces()
    {
        string input = "  Hello   world  This  Is   Spaced   ";
        var result = input.CountWordsStartingWithCapital();
        Assert.That(result, Is.EqualTo(4));
    }
}
As suggested by the name, the CountWordsStartingWithCapital method will count the number of words starting with a capital letter in an input string. The test class contains three test methods that we want to run as part of the pipeline.
Next, I'll declare a basic build pipeline using YAML:
trigger:
- master

pool:
  vmImage: 'windows-latest'

steps:
- task: UseDotNet@2
  displayName: Install .NET 9
  inputs:
    packageType: 'sdk'
    version: '9.0.x'
    installationPath: $(Agent.ToolsDirectory)/dotnet

- task: DotNetCoreCLI@2
  displayName: Build
  inputs:
    command: 'build'
    projects: '**/*.csproj'

- task: DotNetCoreCLI@2
  displayName: Test
  inputs:
    command: 'test'
The pipeline will check out the code, install .NET 9, build the code, and run the unit tests. When pushing the files to Azure DevOps, we see the following on the build output:

Notice how 100% of the tests passed, but 0% of the code is marked as covered. This is because we haven't enabled code coverage yet. When clicking 0% covered, we get the following message on DevOps:
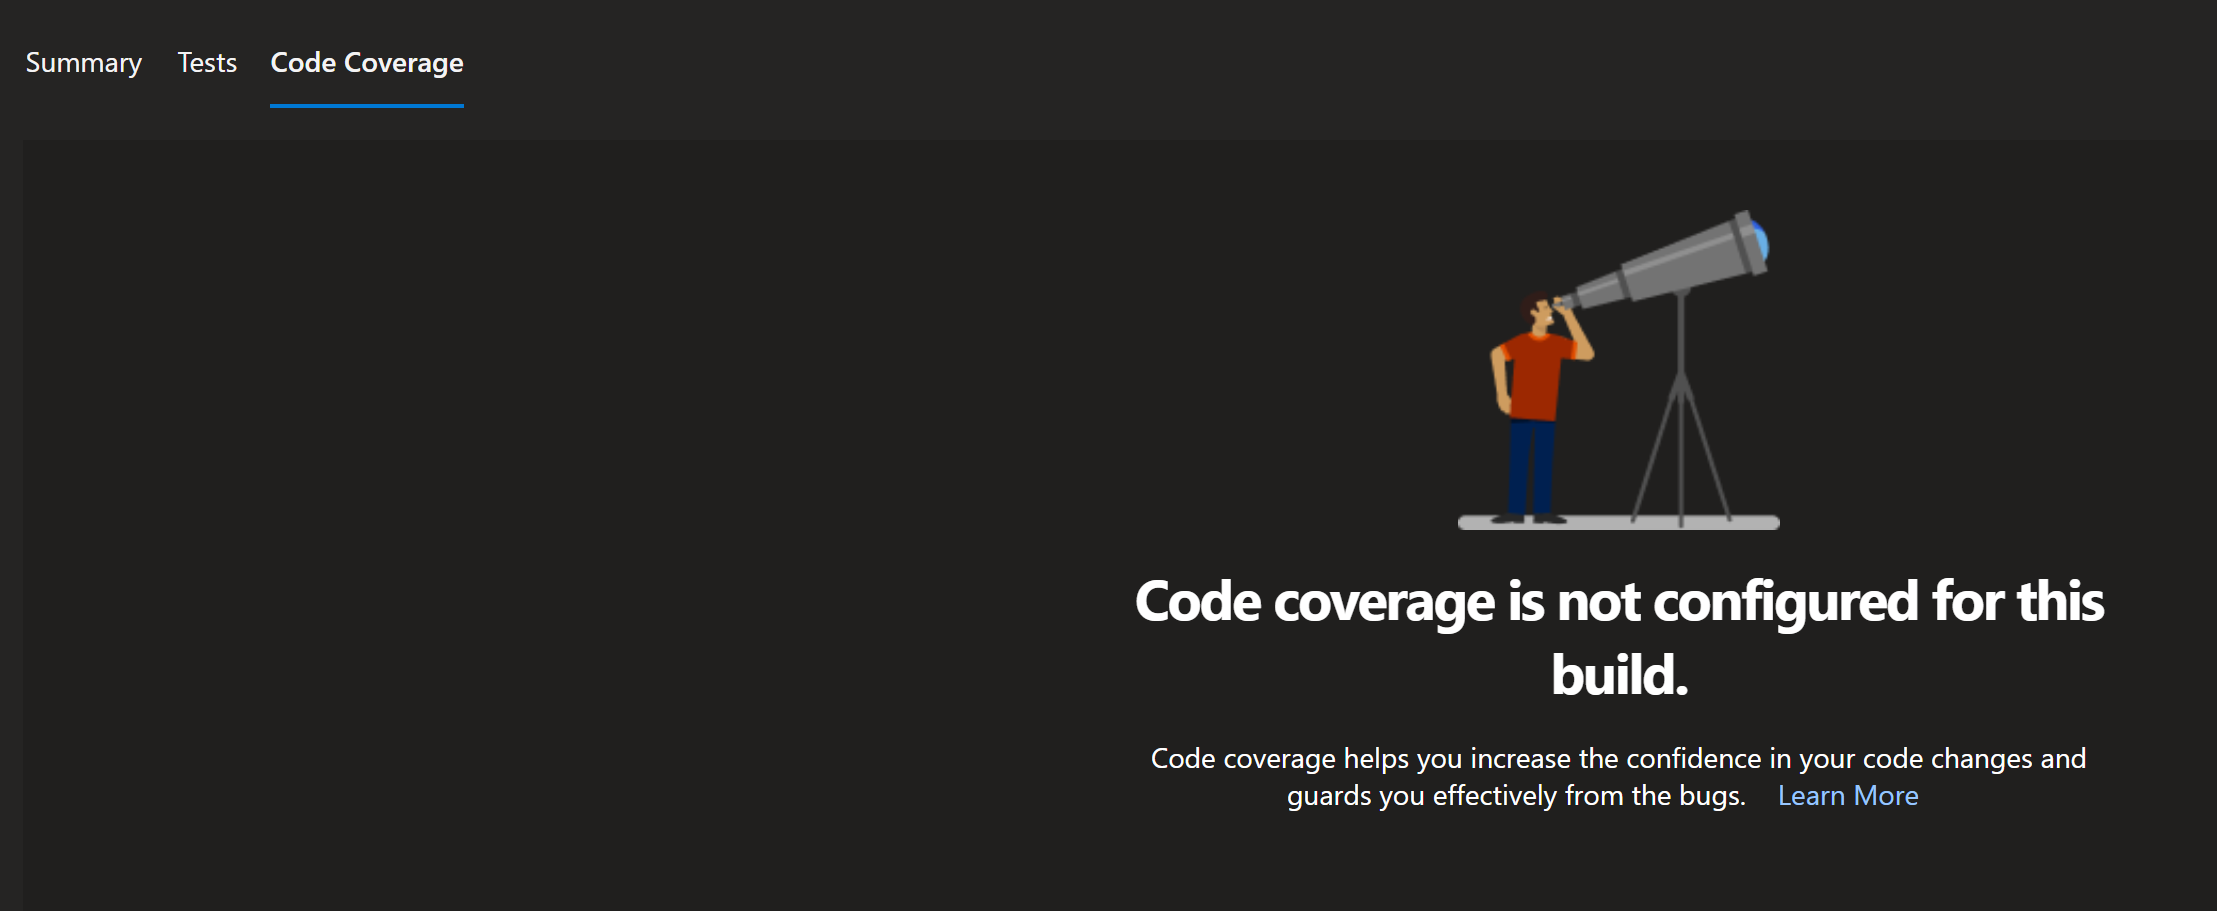
To enable code coverage, we need two things:
- Output code coverage data from the test step.
- Generate a code coverage report and publish it to DevOps.
There are many tools to help measure code coverage as part of a test. I'll use XPlat Code Coverage, which is part of .NET. The tool produces an XML file for further processing when run as part of a dotnet test command and can be enabled by installing the following NuGet package in the test project:
dotnet add package coverlet.collector
And then extending the test step with a single argument:
- task: DotNetCoreCLI@2
  displayName: Test
  inputs:
    command: 'test'
    arguments: '--collect:"XPlat Code Coverage"'
Doing this will output the code coverage data as an XML file when running the test on Azure DevOps (or locally if you prefer).
Next, we will need to process this XML file and generate a nice HTML report to look at in DevOps. One option is using the PublishCodeCoverageResults build task from Microsoft since that comes with a bundle of the report generator I'll use in a minute. But I've learned that using the underlying report generator in its raw form is a better solution. By using the report generator directly, you have greater control over options and which version to run. I'm going to use the excellent tool named ReportGenerator, developed by Daniel Palme. There's both a free and a paid version, but for this post, I'll use the free features only. If you are considering using this for your build pipeline, I encourage you to check out the Pro version to get additional features and to help Daniel maintain the tool.
ReportGenerator takes a code coverage XML as input and generates an HTML report for us to inspect. Exactly what we want here. The easiest way to get ReportGenerator running on Azure DevOps is by installing the ReportGenerator extension for Azure DevOps. Once installed, we can add an additional build step after running the unit tests:
- task: reportgenerator@5
  displayName: ReportGenerator
  inputs:
    reports: '$(Agent.TempDirectory)/**/coverage.cobertura.xml'
    reporttypes: 'HtmlInline_AzurePipelines_Dark;Cobertura'
    targetdir: 'coveragereport'
    publishCodeCoverageResults: true
The build step sends all code coverage XML files to the ReportGenerator tool and generates an HTML report in the coveragereport directory. The build task has native support for publishing the report as part of the build artifacts, so we don't need any additional steps for that. Also, notice that I have applied a custom report type named HtmlInline_AzurePipelines_Dark;Cobertura that controls the look and feel of the HTML report. There's a similar option for light mode if you prefer that.
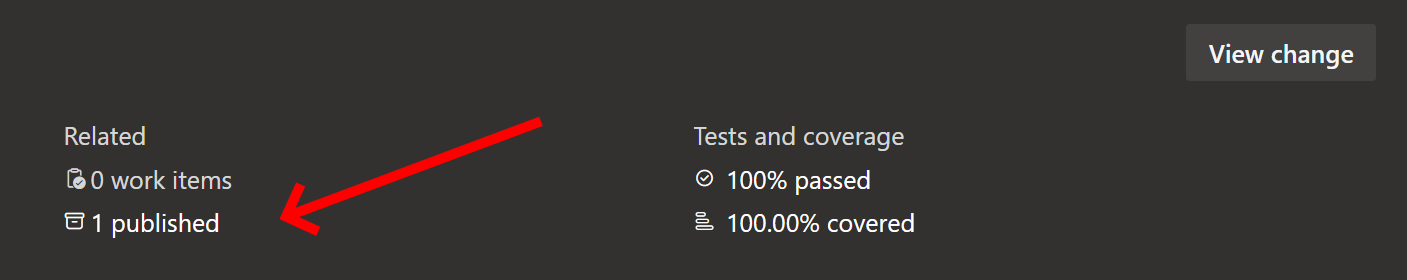
Once the updated YAML file is pushed to Azure DevOps, the code coverage percentage now shows up on the build output:
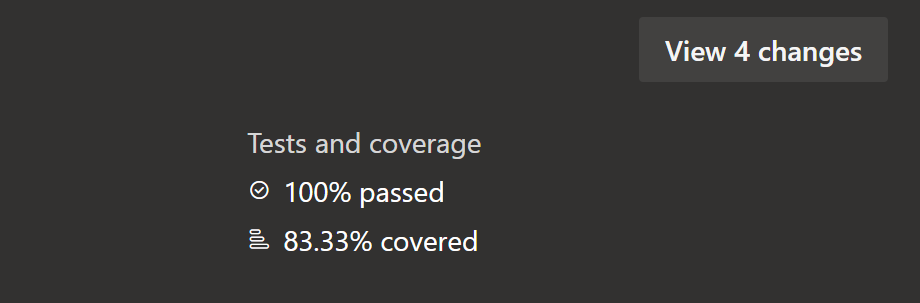
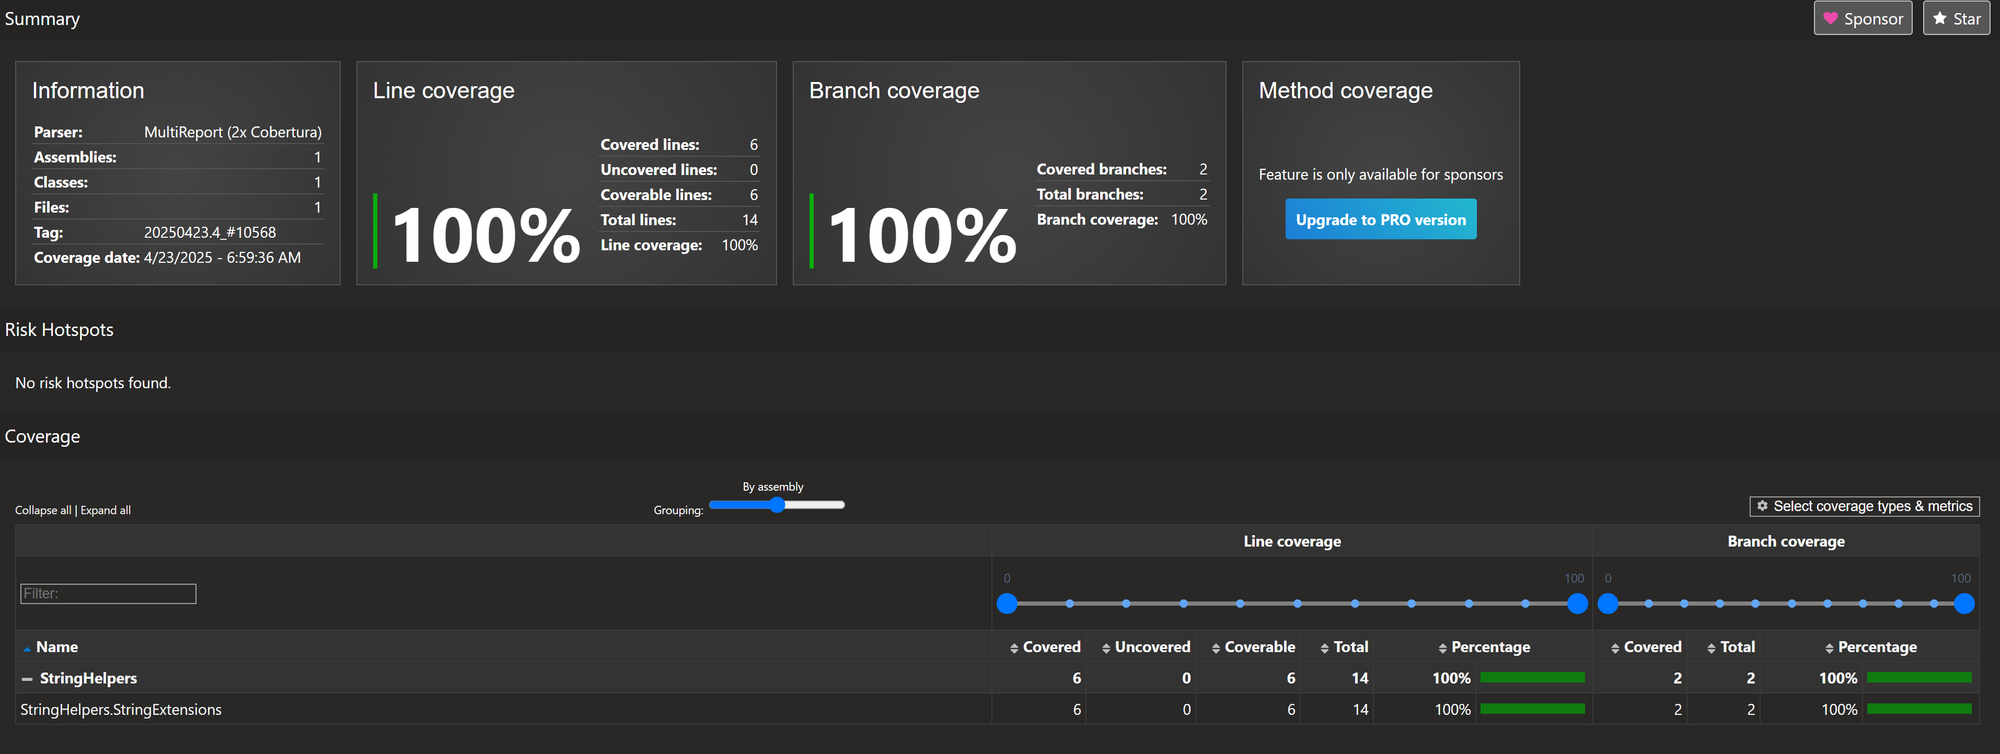
When clicking the 83.33% covered text, we get a nice output like this embedded inside the build report:
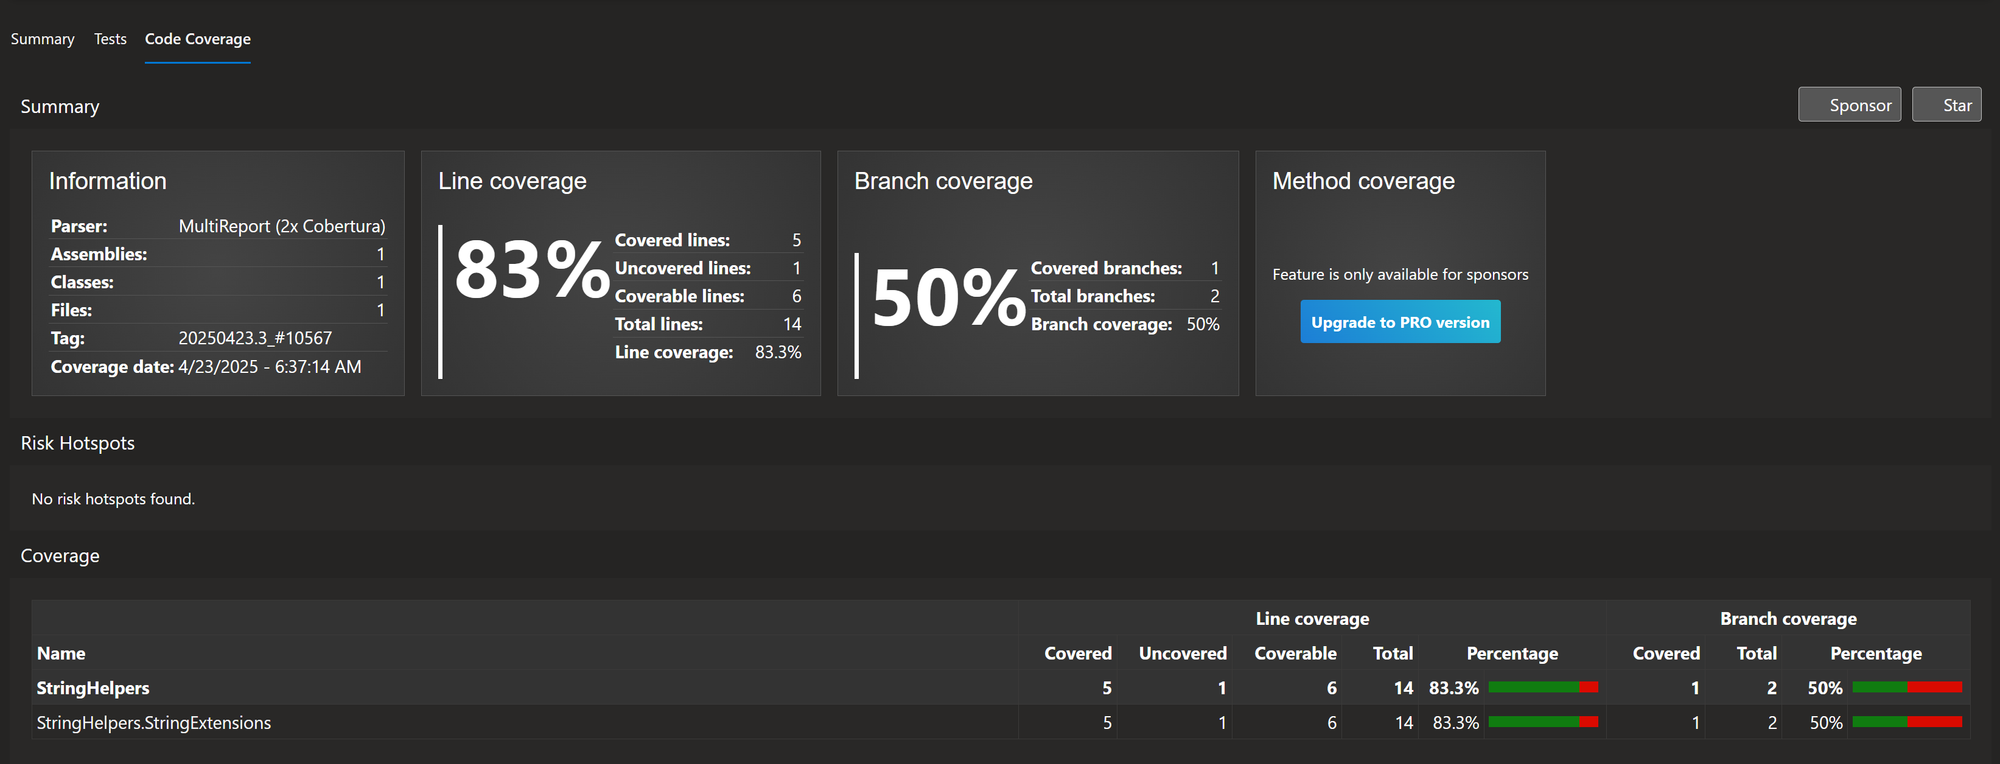
As you can see from the screenshot, 83% of our code is currently covered by unit tests. You can dig down even further by clicking the StringHelpers.StringExtensions class name in the table at the bottom:
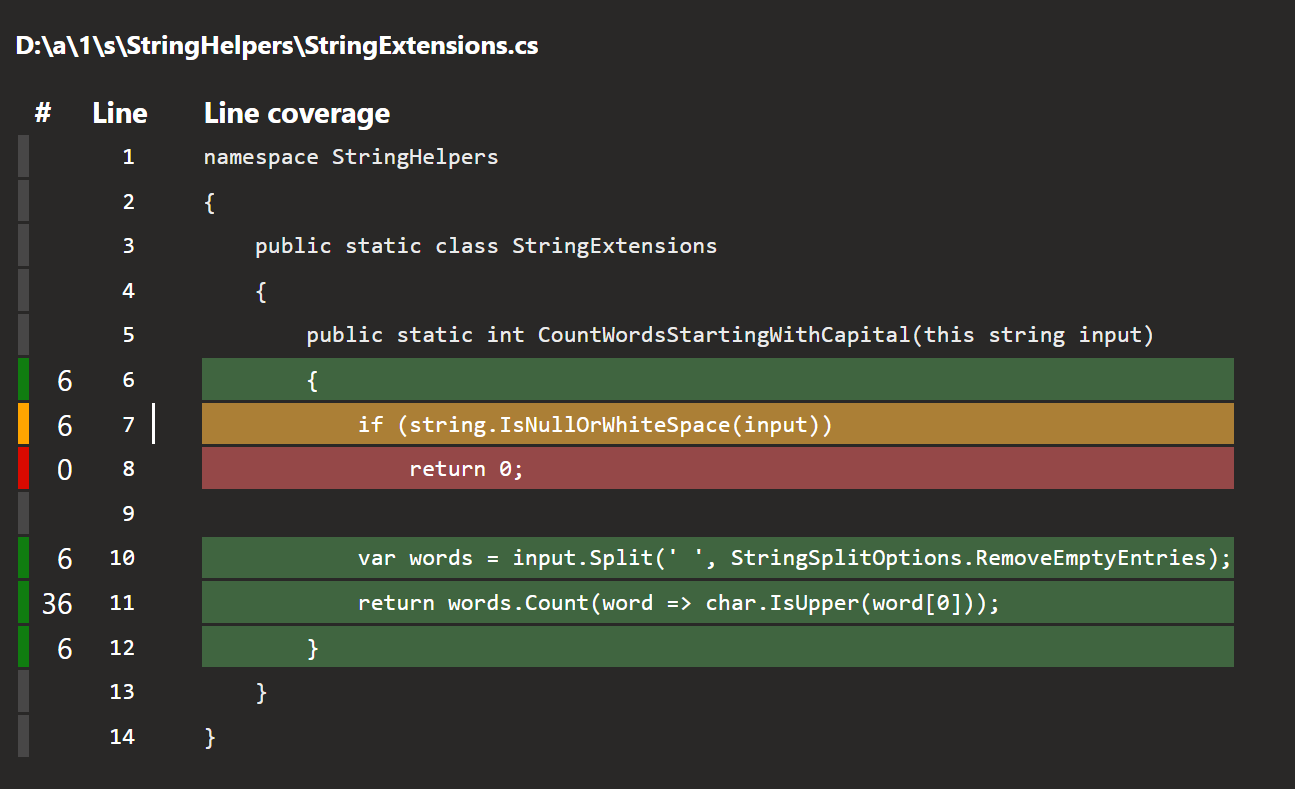
The view shows the actual source code and which lines have been covered. The yellow background color indicates that the line has been touched, but not all possible outcomes of the if statement have been covered. In this case, we didn't test what happens when the input string is null or empty.
Let's fix that by including the following tests in the unit test project and pushing the changes to Azure DevOps:
[TestCase(null)]
[TestCase("")]
[TestCase("     ")]
public void ReturnsZero_WhenInputIs(string input)
{
    var result = input.CountWordsStartingWithCapital();
    Assert.That(result, Is.EqualTo(0));
}
When inspecting the code coverage report, we now see all lines covered:
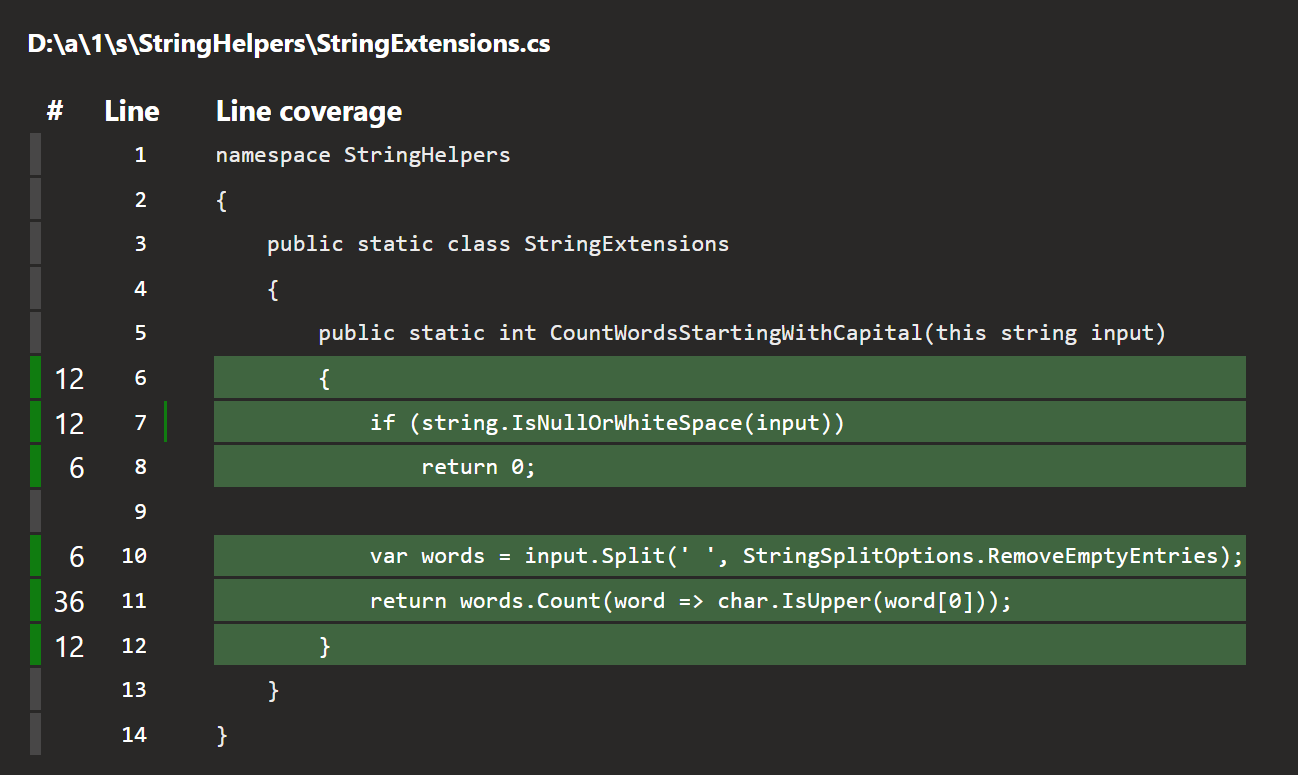
I'll leave it up to you if you want to aim for 100% code coverage like this. In most cases, it won't make sense, but it serves as an example for this post.
If you are familiar with ReportGenerator already, or you have seen some of the examples on the website, you may notice that the report on Azure DevOps doesn't look exactly like the one ReportGenerator generates locally. That's because Azure DevOps blocks JavaScript from executing on artifacts like these. If you want the full set of features, notice that the report is published as an artifact on the build output:
If you download and extract the report files, you can inspect the report locally by launching the index.html file:
This report will look like the one you can generate locally. To generate a local version of the code coverage HTML report, execute the following script:
dotnet test --collect:"XPlat Code Coverage"
dotnet tool install -g dotnet-reportgenerator-globaltool
reportgenerator -reports:**/coverage.cobertura.xml -targetdir:coveragereport -reporttypes:Html
start coveragereport/index.html
Let me close off by telling a story about code coverage from a previous job. I once worked at a large Danish company with a high focus on process. I won't mention any names since the company did well in a lot of other areas. But the process part had taken a downturn somewhere. There was an entire team doing nothing else than defining the process and practices for all of the teams working in the company.
Apparently, one day the process team decided to use code coverage as a way to measure code quality and demanded a specific percentage of code coverage (don't remember the exact number). And we, as developers, were awarded a week to comply with that number. While we had already written a lot of unit tests, having taken over an old project with a long history where unit testing was not carried out, complying with the target from the process team in a week was an impossible task. After some complaining, we were told that this wasn't a goal we could miss and that the estimate could not be expanded. We still ended out reaching the goal, and can you guess how? We sat down and analyzed where we could write the fewest unit tests that covered the most lines of code. Typically, trivial code that shouldn't be high on the priority list. Or even code that would have been better off refactored. The tests had no or few assertions. Just test methods touching as many lines of code as possible 🤦🏻♂️ Remember that this was way before LLMs, so we were limited to what we could manually write or auto-generate.
So, why tell this story? To show you how code coverage can be misunderstood and dangerous in the hands of project managers or for measurement and goals. I hope you see some benefits in using this as an aid in writing unit tests and as a help to uncover important things that should have been tested but haven't.
For reference, here's the full build pipeline:
trigger:
- master

pool:
  vmImage: 'windows-latest'

steps:
- task: UseDotNet@2
  displayName: Install .NET 9
  inputs:
    packageType: 'sdk'
    version: '9.0.x'
    installationPath: $(Agent.ToolsDirectory)/dotnet

- task: DotNetCoreCLI@2
  displayName: Build
  inputs:
    command: 'build'
    projects: '**/*.csproj'

- task: DotNetCoreCLI@2
  displayName: Test
  inputs:
    command: 'test'
    arguments: '--collect:"XPlat Code Coverage"'

- task: reportgenerator@5
  displayName: ReportGenerator
  inputs:
    reports: '$(Agent.TempDirectory)/**/coverage.cobertura.xml'
    reporttypes: 'HtmlInline_AzurePipelines_Dark;Cobertura'
    targetdir: 'coveragereport'
    publishCodeCoverageResults: true
elmah.io: Error logging and Uptime Monitoring for your web apps
This blog post is brought to you by elmah.io. elmah.io is error logging, uptime monitoring, deployment tracking, and service heartbeats for your .NET and JavaScript applications. Stop relying on your users to notify you when something is wrong or dig through hundreds of megabytes of log files spread across servers. With elmah.io, we store all of your log messages, notify you through popular channels like email, Slack, and Microsoft Teams, and help you fix errors fast.

See how we can help you monitor your website for crashes Monitor your website