How to Monitor Your App's Performance with .NET Benchmarking
Benchmarking is essential in application development, especially if you aim to scale up your app. Benchmarking enables you to evaluate your application's resource consumption, which helps you identify potential updates to speed up performance. If not scaling, you will need the application performance to be optimal to enhance user experience and reduce memory and processing costs. In this blog, I will introduce you to the widely used benchmarking library BenchmarkDotNet, used to monitor any .NET application's performance.

What is benchmarking of software applications?
Benchmarking is the process of systematically assessing the performance of a software application under controlled conditions. It includes running the application tasks and analyzing key performance metrics, such as execution time, resource utilization (CPU, memory, I/O), scalability, and reliability. Sometimes the analysis is made by comparing to a baseline, other implementations, or industry standards.
What is BenchmarkDotNet?
BenchmarkDotNet is a .NET NuGet package that allows us to benchmark .NET applications. It is a handy tool for all .NET applications. We need to mark methods [Benchmark] that we need to evaluate. The package generates a separate project for each such method. Let's check step by step how to use it in your application
Example 1: A simple Console application
First, to get started, I am using a simple example in a console application.
Step 1: Install the BenchmarkDotNet package
Either install it from the NuGet Package Manager or from the command line:
dotnet add package BenchmarkDotNet
Step 2: Create a BenchmarkExample class
using BenchmarkDotNet.Attributes;

public class BenchmarkExample
{
    // This method performs a simple operation whose performance we want to benchmark.
    [Benchmark]
    public int SumNumbers()
    {
        int sum = 0;
        for (int i = 1; i <= 1000; i++)
        {
            sum += i;
        }

        return sum;
    }
}

// In Program.cs
using BenchmarkDotNet.Running;

BenchmarkRunner.Run<BenchmarkExample>();
Step 3: Run the project in release mode
For running via the command line:
dotnet build --configuration Release
Then:
dotnet run --configuration Release
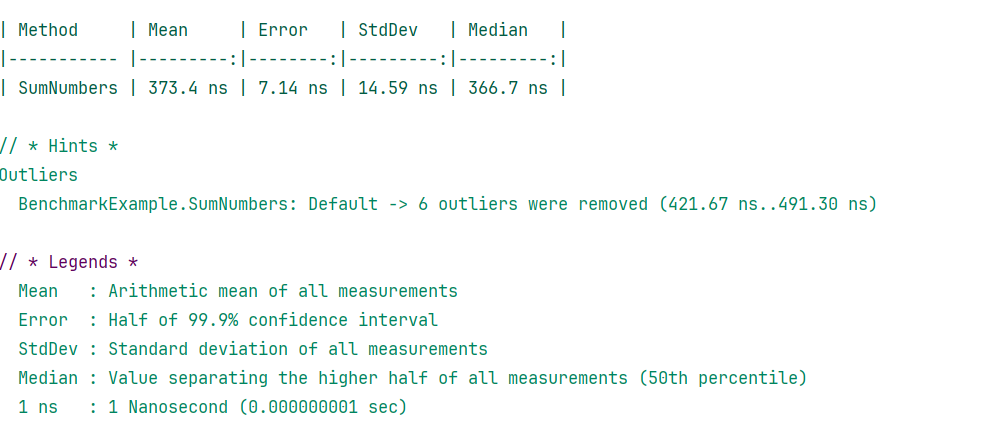
The output from the program will look like this:

When running the project, BenchmarkDotNet identified methods marked with the [Benchmark] attribute. It then analyses the system environment, collecting information like CPU, memory capacity, and runtime. It actually collects background information to document the result with system context.
After that, it warms up the benchmarked code by running it a few times, allowing the JIT compiler to optimize it for fair testing. The process lets the runtime optimize the code to generate accurate results.
Finally, it performs pilot runs to estimate execution time and determine the number of iterations needed for accurate and meaningful measurements. With everything ready, the actual benchmarking begins.
Example 2: Console application with Params
To analyze your application in more detail, you can provide multiple testing parameters on which the benchmark will run and assess it over different input sizes.
We are changing our BenchmarkExample class slightly:
public class BenchmarkExample
{
   // The [Params] attribute is used to specify input values for the benchmark.
   [Params(10, 100, 1000)]
   public int N;

   // This method performs a simple operation whose performance we want to benchmark.
   [Benchmark]
   public int SumNumbers()
   {
       int sum = 0;
       for (int i = 1; i <= N; i++)
       {
           sum += i;
       }
       return sum;
   }
}
We provided several input params:
[Params(10, 100, 1000)]
public int N;
And execute the loop over N:
for (int i = 1; i <= N; i++)
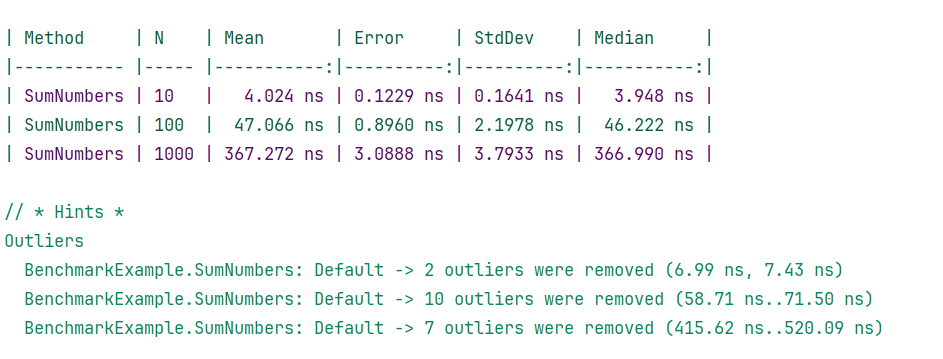
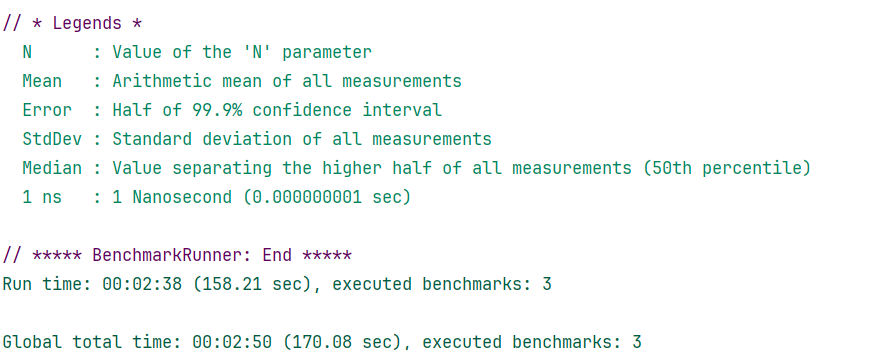
Let's run it and inspect the results:


Example 3: A real example with BenchmarkDotNet annotations
Now that we have understood the basics of benchmarking in a console app. We are moving to a real-world example by introducing some other library annotations. The following example assesses a few sorting algorithms over different input sizes:
public class SortingBenchmark
{
    // Input data for sorting algorithms
    [Params(100, 1000, 10000)]  // Defines the sizes of the arrays to be benchmarked
    public int ArraySize;

    private int[] unsortedArray;

    // Setup method runs before each benchmark method to initialize data
    [GlobalSetup]
    public void Setup()
    {
        var random = new Random();
        unsortedArray = Enumerable
           .Range(0, ArraySize)
           .Select(_ => random.Next(0, 1000))
           .ToArray();
    }

    // Bubble Sort algorithm benchmark
    [Benchmark]
    [BenchmarkCategory("Sorting Algorithms")] // Categorizes this benchmark under "Sorting Algorithms"
    public void BubbleSort()
    {
        var array = (int[])unsortedArray.Clone();  // Clone to ensure a fresh copy
        for (int i = 0; i < array.Length - 1; i++)
        {
            for (int j = 0; j < array.Length - 1 - i; j++)
            {
                if (array[j] > array[j + 1])
                {
                    var temp = array[j];
                    array[j] = array[j + 1];
                    array[j + 1] = temp;
                }
            }
        }
    }

    // Quick Sort algorithm benchmark
    [Benchmark]
    [BenchmarkCategory("Sorting Algorithms")] // Categorizes this benchmark under "Sorting Algorithms"
    public void QuickSort()
    {
        var array = (int[])unsortedArray.Clone();  // Clone to ensure a fresh copy
        QuickSortMethod(array, 0, array.Length - 1);
    }

    // Helper method for Quick Sort
    private void QuickSortMethod(int[] array, int low, int high)
    {
        if (low < high)
        {
            int pivot = Partition(array, low, high);
            QuickSortMethod(array, low, pivot - 1);
            QuickSortMethod(array, pivot + 1, high);
        }
    }

    // Helper method to partition the array for Quick Sort
    private int Partition(int[] array, int low, int high)
    {
        int pivot = array[high];
        int i = low - 1;
        for (int j = low; j < high; j++)
        {
            if (array[j] < pivot)
            {
                i++;
                var temp = array[i];
                array[i] = array[j];
                array[j] = temp;
            }
        }
        var swap = array[i + 1];
        array[i + 1] = array[high];
        array[high] = swap;
        return i + 1;
    }
}

// Program.cs:

var summary = BenchmarkRunner.Run<SortingBenchmark>(); // Runs the benchmark
The method marked with the [GlobalSetup] attribute is called before each benchmark iteration. It prepares the environment and input for the benchmark method. In this case, it generates a random array based on the size specified in ArraySize.
The [BenchmarkCategory] attribute allows users to categorize benchmarks under a specific group. In our case, the sorting methods are categorized under "Sorting Algorithms" based on their type and use. This eases when analyzing results, especially if there are multiple categories of benchmarks.
This is the output from the benchmark:


More annotations can be added to our code for additional details. Before the class add the following attributes:
[MemoryDiagnoser]
[RankColumn]
[Orderer(BenchmarkDotNet.Order.SummaryOrderPolicy.FastestToSlowest)]
public class SortingBenchmark

// Remaining code
[MemoryDiagnoser]Diagnoses memory usage (bytes assigned and the frequency of garbage collection) of the benchmarked methods.[RankColumn]Adds a rank column to the output for better comparison of benchmarked methods.[Orderer(BenchmarkDotNet.Order.SummaryOrderPolicy.FastestToSlowest)]Orders the methods by execution time from fastest to slowest. We can tune other policies as well.
Output:

When seeing all the results, we can conclude that quicksort outperformed bubble sort.
Why use BenchmarkDotNet?
BenchmarkDotNet enables you to measure key metrics with a simple syntax. As we saw in the example, you don't need to dive too much into implementation details or maintain large boilerplate code. All you need is to install a NuGet package and use appropriate annotations. It has several annotations that provide implementations for different options. Despite its simplicity, it ensures accuracy in performance measurements. It runs benchmarks multiple times and statistically analyses the results to achieve high accuracy. Moreover, the outliers are also detected and eliminated during the calculations. One key feature of the library is that it runs each benchmark in isolation to ensure no other process or system noise affects the result.
BenchmarkDotnet is good in terms of scalability as it provides [BenchmarkCategory] to logically categorize methods, which is useful when your application is large. It enables you to see memory allocations for the methods fulfilling the requirements of a good benchmarking tool. It not only analyzes and displays memory usage to a granular level but also detects memory leakages. The tabular result generation is also comprehensive and easy to understand. You can find every significant insight for the applications such as "Mean", "Error", “Allocated” and "StdDev". The tool is supported by many popular platforms including macOS, Linux, and Windows.
Conclusion
Benchmarking is crucial for optimizing application performance, and BenchmarkDotNet simplifies this process for .NET developers. By using its annotations, the library benchmarks methods independently ensures precision, and provides detailed, tabular insights. Its easy integration and accuracy make it an essential tool for performance improvement.
elmah.io: Error logging and Uptime Monitoring for your web apps
This blog post is brought to you by elmah.io. elmah.io is error logging, uptime monitoring, deployment tracking, and service heartbeats for your .NET and JavaScript applications. Stop relying on your users to notify you when something is wrong or dig through hundreds of megabytes of log files spread across servers. With elmah.io, we store all of your log messages, notify you through popular channels like email, Slack, and Microsoft Teams, and help you fix errors fast.
See how we can help you monitor your website for crashes Monitor your website
