Get better insights with the error occurence graph
Ever had that feeling of déjà vu when looking through your logs? You drill down into the details on an error and think to yourself: I’ve seen this before!
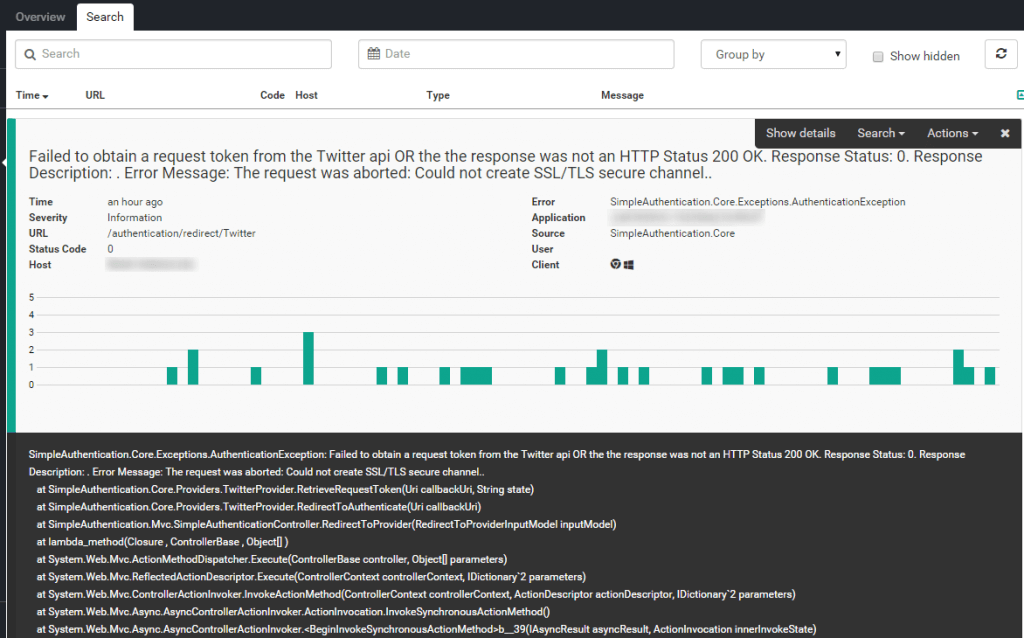
In the latest release, we start to provide you with better insights into the errors logged from your website. First step involves the error details view, visible when expanding an error from the search view. With the improved error details view, you will be presented with a graph, showing the occurrence of the expanded error, in the entire retention period included in your current plan:

In this example, the AuthenticationException thrown inside the SimpleAuthentication package occurred multiple times during the last 90 days. The improved details view, will help you gain a better understanding of the error severity.
elmah.io: Error logging and Uptime Monitoring for your web apps
This blog post is brought to you by elmah.io. elmah.io is error logging, uptime monitoring, deployment tracking, and service heartbeats for your .NET and JavaScript applications. Stop relying on your users to notify you when something is wrong or dig through hundreds of megabytes of log files spread across servers. With elmah.io, we store all of your log messages, notify you through popular channels like email, Slack, and Microsoft Teams, and help you fix errors fast.
See how we can help you monitor your website for crashes Monitor your website
