
Error monitoring and detailed logging of an ASP.NET Core application with PostSharp and elmah.io
This is a cross-post from the PostSharp Blog. Original post here: https://postsharp.net/blog/error-monitoring-and-detailed-logging-asp-net-core-application
In this article, we show how to add error monitoring and detailed logging to an ASP.NET Core application. These features help you diagnose and fix errors. We will be using elmah.io, an error monitoring service, and PostSharp Logging, a .NET library for detailed logging.
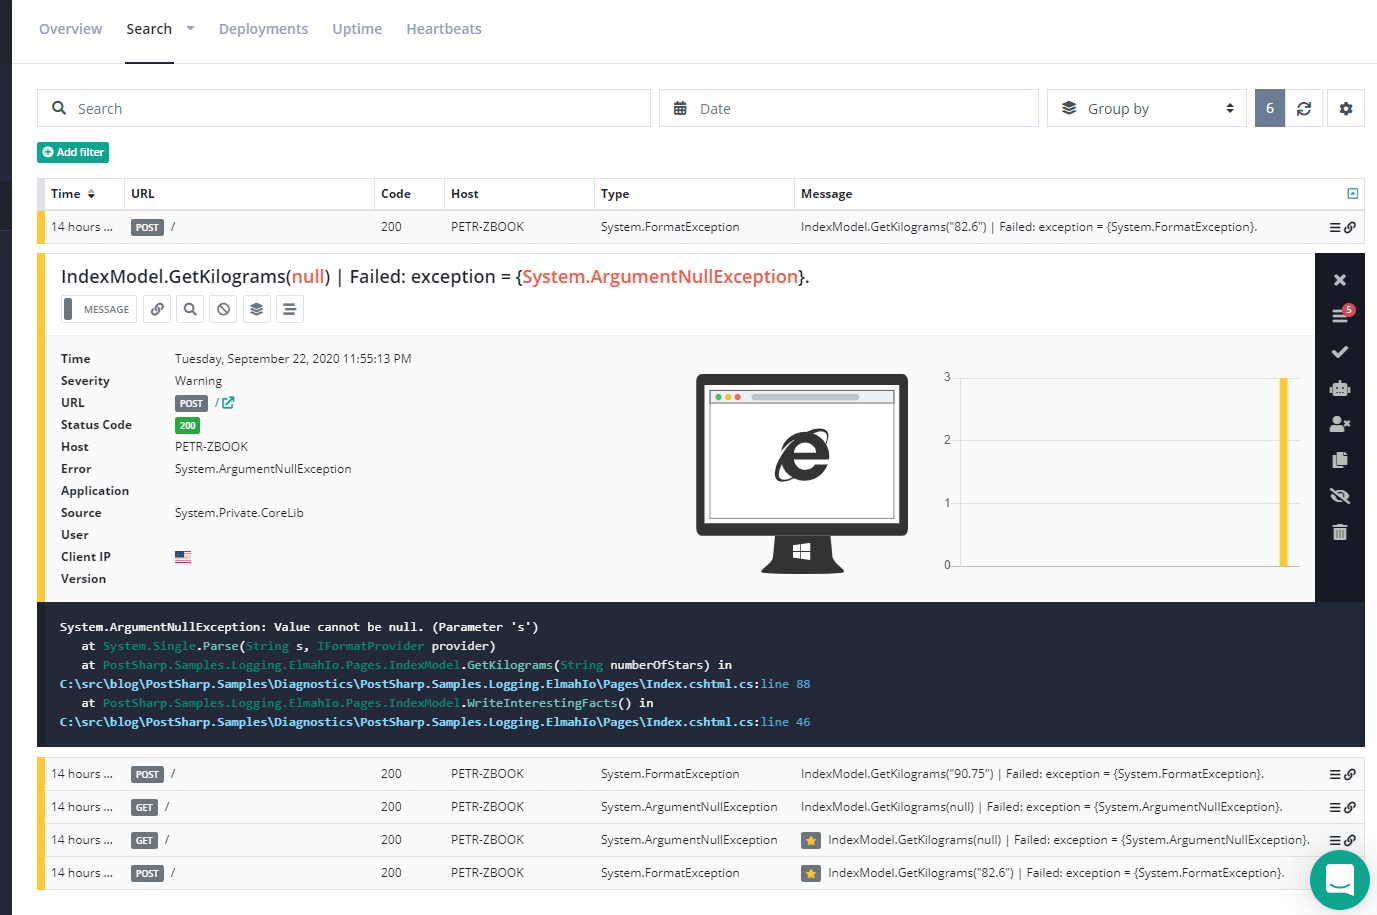
We’ll start with an existing application that logs nothing and just by adding a few lines in the startup code, we will add automatic advanced error reporting. When we’re done, you’ll be able to browse through errors that occurred while processing web requests on the elmah.io website:
And you’ll be able to trace the root causes or other contextual information about the errors in detailed log files like this:
2020-09-22 23:55:13[DBG] IndexModel.OnPost() | Starting.
2020-09-22 23:55:13[DBG]   IndexModel.WriteInterestingFacts() | Starting.
2020-09-22 23:55:13[DBG]     IndexModel.get_NumberOfKgs() | Starting.
2020-09-22 23:55:13[DBG]     IndexModel.get_NumberOfKgs() | Succeeded: returnValue = "null".
2020-09-22 23:55:13[DBG]     IndexModel.GetKilograms("null") | Starting.
2020-09-22 23:55:13[WRN]     IndexModel.GetKilograms("null") | Failed: exception = {"System.ArgumentNullException"}.
System.ArgumentNullException: Value cannot be null. (Parameter 's')
   at System.Single.Parse(String s, IFormatProvider provider)
   at PostSharp.Samples.Logging.ElmahIo.Pages.IndexModel.GetKilograms(String numberOfStars) in C:\src\blog\PostSharp.Samples\Diagnostics\PostSharp.Samples.Logging.ElmahIo\Pages\Index.cshtml.cs:line 88
2020-09-22 23:55:13[DBG]   IndexModel.WriteInterestingFacts() | Succeeded.
2020-09-22 23:55:13[DBG] IndexModel.OnPost() | Succeeded.
Example application
In this article, we’ll be modifying a .NET Core web app based on the starter template that we call “What am I made of?”. You enter your mass in kilograms and the app gives you fun and interesting factoids about your body:
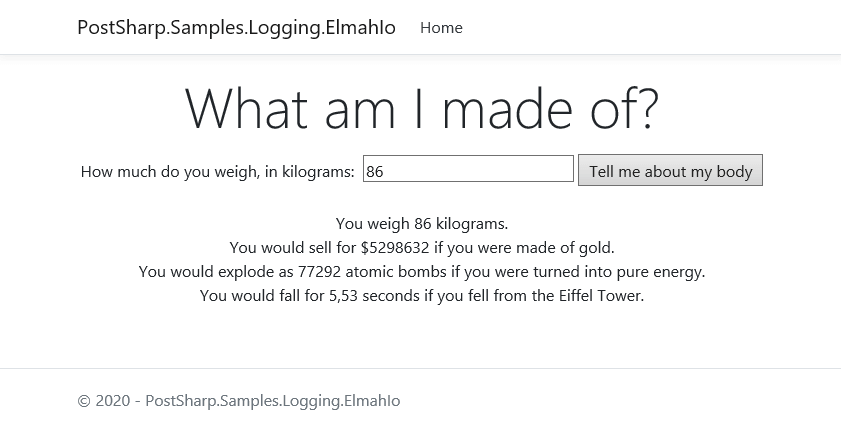
Now suppose that we released it and users started writing emails to us that the app isn’t calculating factoids for them. How do you figure out what’s wrong?
Adding error monitoring with elmah.io
elmah.io is a cloud-based error monitoring service. Your application functions as a client that sends warnings and errors over the internet to elmah.io servers and you, as the app maintainer, can then browse through these errors and analyze them in the elmah.io web dashboard.
You’ll need to create a new account (there is a free trial) to get your API key and log ID.
We’ll be using Serilog as the in-between link between PostSharp and elmah.io.
You’ll need some NuGet packages. Download and install these:
- Serilog.Sinks.ElmahIO (sends data from Serilog to the elmah.io service)
- Elmah.Io.AspNetCore.Serilog (adds additional request-based information to logs)
In your Main method, set up Serilog logging like this:
// Set up Serilog:
Log.Logger =
 new LoggerConfiguration()
   .MinimumLevel.Debug() // Capture all logs (PostSharp by default logs most traces at the Debug level)
   .Enrich.FromLogContext() // Add information from the web request to Serilog (used by elmah.io)
   .WriteTo.ElmahIo(new ElmahIoSinkOptions(
     "YOUR_API_KEY", // Use key and ID from your elmah.io account
     new Guid("YOUR_LOG_ID")
     )
   {
       MinimumLogEventLevel = LogEventLevel.Warning // only send warnings and errors to elmah.io
   })
   .CreateLogger();
In your Startup class, add this after app.UseAuthorization();:
// This adds additional properties with information about
// the web request to Serilog logging events:
app.UseElmahIoSerilog();
Now you’re set up to use Serilog with elmah.io. If you added Serilog logging to your application, log lines at warning level or above would get sent to elmah.io.
But we want to have logging and error monitoring without adding manual logging statements to the application, so we’ll proceed with setting up PostSharp instead.
Adding detailed logging with PostSharp Logging
PostSharp Logging is a library that adds automatic detailed logging to your code. You annotate your code with attributes, and PostSharp adds logging statements in your methods on its own during compilation.
To set it up, you’ll need to get a license and install it in your application. One way to install it is using our Visual Studio extension but you can also add it to the source code directly. There is a free 45-day trial as well as a free edition with some limitations.
To set it up, you first need some additional NuGet packages:
- PostSharp.Patterns.Diagnostics (transforms [Log] attributes into logging statements)
- PostSharp.Patterns.Diagnostics.Serilog (sends automatic logging to Serilog)
- Serilog.Sinks.File (saves Serilog logs into a file)
- Serilog.Sinks.ColoredConsole (when developing, it’s faster to check the console than a file)
Then, in your initialization code, replace the Serilog initialization code with this:
// Set up Serilog:
const string formatString = @"{Timestamp:yyyy-MM-dd HH:mm:ss}[{Level:u3}] {Indent:l}{Message}{NewLine}{Exception}";
Log.Logger =
 new LoggerConfiguration()
   .MinimumLevel.Debug() // Capture all logs (PostSharp by default logs most traces at the Debug level)
   .Enrich.FromLogContext() // Add information from the web request to Serilog (used by elmah.io)
   .WriteTo.ColoredConsole(outputTemplate: formatString) // Pretty formatting and indentation for console/file
   .WriteTo.File("log.log", outputTemplate: formatString)
   .WriteTo.ElmahIo(new ElmahIoSinkOptions(
     "YOUR_API_KEY", // Use key and ID from your elmah.io account
     new Guid("YOUR_LOG_ID")
     )
   {
       MinimumLogEventLevel = LogEventLevel.Warning // only send warnings and errors to elmah.io
   })
   .CreateLogger();

// Set up PostSharp Logging:
LoggingServices.DefaultBackend = new SerilogLoggingBackend(Log.Logger)
{
 Options =
 {
   // Add exception stack traces to both detailed and elmah.io logs:
   IncludeExceptionDetails = true
 }
};
This means that PostSharp Logging will now create a log line into Serilog for each method you annotate with the attribute [Log]. But, you can also use multicasting to annotate the entire assembly by putting this line at the top of any file:
// Add PostSharp Logging to all methods and properties in the entire application:
[assembly: Log]
That’s all the code we need to write. Let’s see it in action now!
Debugging an issue with error monitoring and logging
Let’s get back to our example app and suppose that we’re receiving reports from users that the facts aren’t being calculated. So you open your elmah.io dashboard and look for warnings and errors. You find one particular suspicious warning:
Even though the exception was handled by the app, PostSharp reported it to elmah.io and you get the stack trace and also the method name and arguments. You can expand the line to go through even more information about the request provided by elmah.io.
Now, you may already be groaning or smiling, having spent hours on this kind of bug in other applications. But if you haven’t, it’s strange, right?
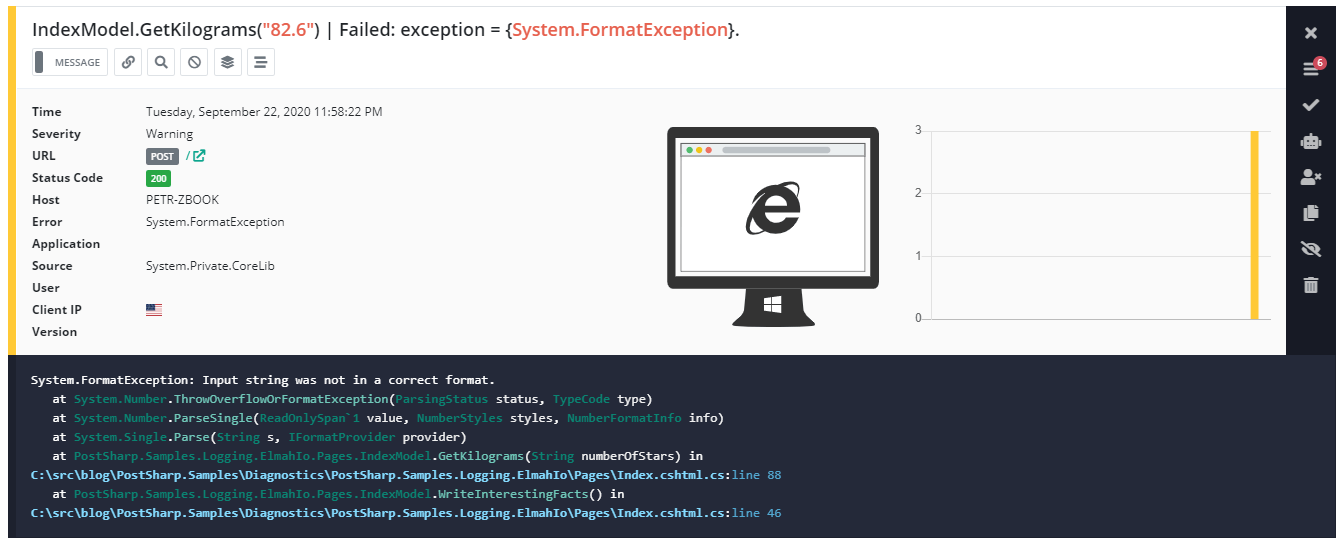
The exception message isn’t very helpful, but PostSharp Logging tells you the method received “82.6” as input, and elmah.io reports 82.6 as a POST parameter. That’s a valid number of kilograms a person might weigh, and indeed, if you type this number in the browser yourself, it works. But you can’t really close this as works-for-me: you have the evidence that it doesn’t right in front of you in the dashboard.
But you can now look at more detailed tracing of what happened during the request. Let’s open up the detailed log file at around the timestamp when the exception occurred.
Here’s what we get:
2020-09-22 11:58:22[DBG] IndexModel.OnPost() | Starting.
2020-09-22 11:58:22[DBG]   IndexModel.WriteInterestingFacts() | Starting.
2020-09-22 11:58:22[DBG]     IndexModel.get_NumberOfKgs() | Starting.
2020-09-22 11:58:22[DBG]     IndexModel.get_NumberOfKgs() | Succeeded: returnValue = "82.6".
2020-09-22 11:58:22[DBG]     IndexModel.GetKilograms("82.6") | Starting.
2020-09-22 11:58:22[DBG]       IndexModel.GetUserCulture() | Starting.
2020-09-22 11:58:22[DBG]       IndexModel.GetUserCulture() | Succeeded: returnValue = {cs-CZ}.
2020-09-22 11:58:22[WRN]     IndexModel.GetKilograms("82.6") | Failed: exception = {System.FormatException}.
System.FormatException: Input string was not in a correct format.
  at System.Number.ThrowOverflowOrFormatException(ParsingStatus status, TypeCode type)
  at System.Number.ParseSingle(ReadOnlySpan`1 value, NumberStyles styles, NumberFormatInfo info)
  at System.Single.Parse(String s, IFormatProvider provider)
  at PostSharp.Samples.Logging.ElmahIo.Pages.IndexModel.GetKilograms(String numberOfStars) in C:\src\blog\PostSharp.Samples\Diagnostics\PostSharp.Samples.Logging.ElmahIo\Pages\Index.cshtml.cs:line 88
2020-09-22 11:58:22[DBG]     IndexModel.set_Result("I can't tell you anything about your body.") | Starting.
2020-09-22 11:58:22[DBG]     IndexModel.set_Result("I can't tell you anything about your body.") | Succeeded.
2020-09-22 11:58:22[DBG]   IndexModel.WriteInterestingFacts() | Succeeded.
2020-09-22 11:58:22[DBG] IndexModel.OnPost() | Succeeded.
And there’s our root cause. PostSharp tells you that the method GetUserCulture, called right before the failing method call, returned cs-CZ, a culture that uses a comma as the decimal separator! The application must have been programmed to use the client’s culture which explains why the same input works for you and doesn’t for some of your users.
Conclusion
In this article, we presented a way to combine elmah.io and PostSharp to add detailed automatic logging and easy-to-use error reporting to an ASP.NET Core application, and how to use these features to find and fix errors.
You can learn more about elmah.io here, more about PostSharp here, and you can download our example application at GitHub.
elmah.io: Error logging and Uptime Monitoring for your web apps
This blog post is brought to you by elmah.io. elmah.io is error logging, uptime monitoring, deployment tracking, and service heartbeats for your .NET and JavaScript applications. Stop relying on your users to notify you when something is wrong or dig through hundreds of megabytes of log files spread across servers. With elmah.io, we store all of your log messages, notify you through popular channels like email, Slack, and Microsoft Teams, and help you fix errors fast.

See how we can help you monitor your website for crashes Monitor your website