elmah.io 20140412 released
We just released a lot of changes to elmah.io. In this post I would like to highlight a single thing: Say hello to my little friend the new overview tab!

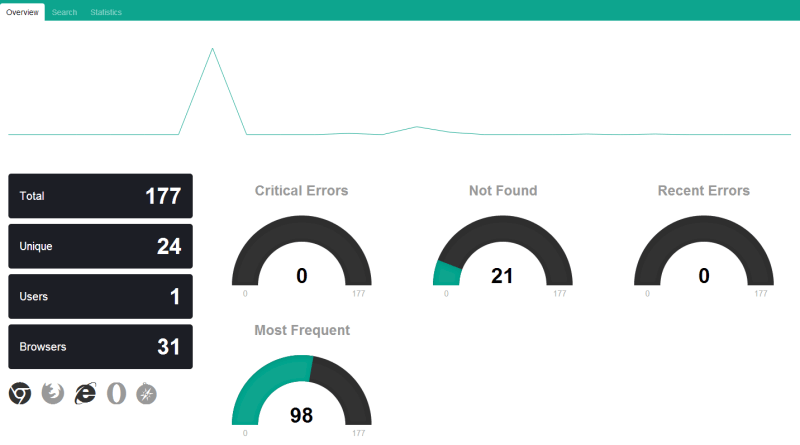
The overview page is a great addition to the three existing (and awesome) tabs, visualizing your log in different ways. The idea behind the overview tab is to give you a quick overview of the errors happening within the last 24 hours. You will be directed to the new tab automatically, when you visit your log. The overview tab can be used at your desktop and mobile device, but the page is optimized to be presented on a flat screen as well.
In the top you will find a graph showing when the errors are happening throughout the day. You may recognize this graph from the dashboard.
Summary
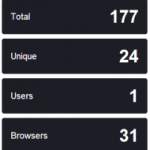
To the left there are 4 boxes showing a summarized view of all of the errors. The Total box shows the total count of errors. The Unique box shows you if the same errors are happening over and over again or if the errors are different. The Users box shows you how many users are affected by the errors. The users count is based by logged in users, why this only works if your website supports this. The Browsers box shows how many browsers are affected. For now we don’t group any of the browsers in this count, why different versions of Firefox or Chrome would count as individual browsers. This leads us to the next section, which actually groups browsers.

Browsers
Below the totals, there’s an indicator showing the 5 most popular browsers. If a browser is affected during the last 24 hours, the browser icon will light up (using the black color). Unaffected browsers are painted light gray.

Gauges
To the right we have added 4 gauges. We will be adding more widgets here, but until now you will be able to see how many Critical (status code 500) and Not Found (status code 404) errors occurred. The Recent Errors gauge shows you how many of the total errors which have occurred during the last hour. This way you will be able to monitor if a lot of errors are logged after you release a new version of your software. The final gauge shows the count of the Most Frequent errors compared to the total count. This will help you determine if the same error is happening multiple times.

We will keep adding features to the new tab, helping you get a better overview of your errors. The following ideas are in the pipeline:
More widgets
- Possible to click the widgets and get directly to the search result
- Auto-refresh
- Possible to adjust the timespan to show errors from the last 5 minutes, last hour etc.
- Move the features from the Statistics tab to the Overview tab.
elmah.io: Error logging and Uptime Monitoring for your web apps
This blog post is brought to you by elmah.io. elmah.io is error logging, uptime monitoring, deployment tracking, and service heartbeats for your .NET and JavaScript applications. Stop relying on your users to notify you when something is wrong or dig through hundreds of megabytes of log files spread across servers. With elmah.io, we store all of your log messages, notify you through popular channels like email, Slack, and Microsoft Teams, and help you fix errors fast.
See how we can help you monitor your website for crashes Monitor your website
