
ASP.NET Core middleware with Roslyn Analyzers - Part 2
This is the second post in the series about Roslyn analyzers with ASP.NET Core middleware. If you haven't read part 1 already, go ahead a do that for a general introduction. In this post, I'll continue the example from the first post and start looking at the order middleware are added.
Setting up middleware often isn't enough for everything to work properly. The order in which different middleware components are added is important for almost all features in ASP.NET Core. As mentioned in the previous post, middleware works like pearls on a string. The order you add your middleware determines which middleware is called first and which is called last. If you add exception handling middleware too soon or too late, important errors in the pipeline, are never picked up and handled.
Let's create a new analyzer that validates the right placement of a middleware component. Again, I'm using the elmah.io middleware, but that's because I already wrote the code for that. You can implement this for any middleware.
The code will go into a new analyzer, why I create a new file named UseElmahIoOrderAnalyzer.cs. The overall structure looks similar to the analyzer from the previous post:
[DiagnosticAnalyzer(LanguageNames.CSharp)]
public class UseElmahIoOrderAnalyzer : DiagnosticAnalyzer
{
    public const string DiagnosticId = "EIO1002";

    private static DiagnosticDescriptor Rule = new DiagnosticDescriptor(
        DiagnosticId,
        "UseElmahIo must be called in the right order",
        "UseElmahIo must be called after {1}",
        "Elmah.Io.CSharp.AspNetCoreRules",
        DiagnosticSeverity.Warning,
        isEnabledByDefault: true);

    public override ImmutableArray<DiagnosticDescriptor> SupportedDiagnostics { get { return ImmutableArray.Create(Rule); } }

    public override void Initialize(AnalysisContext context)
    {
    }
}
I changed two things: the analyzer id (DiagnosticId) and the text messages inside the DiagnosticDescriptor. Notice how the second message is no longer simply a hard-coded string. Analyzers support formatting too, which we will dig into in a bit.
The analyzer should only run on the method named Configure in classes named Startup. Let's repeat how the first lines from the Initialize method can decide if the analyzer should run or not:
context.RegisterCodeBlockStartAction<SyntaxKind>(cb =>
{
    if (cb.OwningSymbol.Kind != SymbolKind.Method) return;
    var method = (IMethodSymbol)cb.OwningSymbol;
    // We only care about methods named ConfigureServices
    if (method.Name != "Configure") return;
    if (method.ContainingType.Name != "Startup") return;

    // ...
});
With that out of the way, let's start implementing the rule. For the UseElmahIo method, I want to make sure that it is called after any calls to UseDeveloperExceptionPage or UseExceptionHandler. To implement this in the most simple way I can imagine, my analyzer will iterate through the Configure method and remember all calls starting with Use and in the end, verify that the order is correct:
Location useElmahIoLocation = null;
List<string> calls = new List<string>();
cb.RegisterSyntaxNodeAction(ctx =>
{
    var node = ctx.Node as InvocationExpressionSyntax;
    if (node == null) return;
    var expression = node.Expression as MemberAccessExpressionSyntax;
    if (expression == null) return;
    var methodName = expression.Name?.Identifier.ValueText;
    if (string.IsNullOrWhiteSpace(methodName) || !methodName.StartsWith("Use")) return;
    calls.Add(methodName);
    if (methodName.Equals("UseElmahIo")) useElmahIoLocation = expression.GetLocation();
}, SyntaxKind.InvocationExpression);
I register a syntax node action once we are inside the Configure method. If you lost track of where this code should be placed you can relax. The full code is available later in this post 😃 The code stores any method invocations starting with Use. It also saves the location of the UseElmahIo method, which we will use when reporting the warning.
Once we are out of scope of the Configure method, we can inspect the invoked methods:
cb.RegisterCodeBlockEndAction(ctx =>
{
    // EIO1001 will catch this
    if (!calls.Contains("UseElmahIo")) return;

    var index = calls.IndexOf("UseElmahIo");
    var useDeveloperExceptionPageIndex = calls.IndexOf("UseDeveloperExceptionPage");
    var useExceptionHandlerIndex = calls.IndexOf("UseExceptionHandler");

    if (useDeveloperExceptionPageIndex != -1 && index < useDeveloperExceptionPageIndex)
        Report(ctx, useElmahIoLocation, "UseDeveloperExceptionPage");
    else if (useExceptionHandlerIndex != -1 && index < useExceptionHandlerIndex)
        Report(ctx, useElmahIoLocation, "UseExceptionHandler");
});
The Report method should look familiar to what you've already seen, so let's jump in:
private void Report(CodeBlockAnalysisContext context, Location location, string use)
{
    var diag = Diagnostic.Create(Rule, location, use);
    context.ReportDiagnostic(diag);
}
The method reports the warning to Visual Studio. Depending on which method name was sent by the analyzer, the Diagnostic.Create method replaces {0} in the message with the method name provided by the analyzer (UseDeveloperExceptionPage or UseExceptionHandler).
Let's look at the entire Initialize method:
public override void Initialize(AnalysisContext context)
{
    context.RegisterCodeBlockStartAction<SyntaxKind>(cb =>
    {
        // We only care about method bodies.
        if (cb.OwningSymbol.Kind != SymbolKind.Method) return;
        var method = (IMethodSymbol)cb.OwningSymbol;
        // We only care about methods named ConfigureServices
        if (method.Name != "Configure") return;
        if (method.ContainingType.Name != "Startup") return;
        Location useElmahIoLocation = null;

        List<string> calls = new List<string>();

        cb.RegisterSyntaxNodeAction(ctx =>
        {
            var node = ctx.Node as InvocationExpressionSyntax;
            if (node == null) return;
            var expression = node.Expression as MemberAccessExpressionSyntax;
            if (expression == null) return;
            var methodName = expression.Name?.Identifier.ValueText;
            if (string.IsNullOrWhiteSpace(methodName) || !methodName.StartsWith("Use")) return;
            calls.Add(methodName);
            if (methodName.Equals("UseElmahIo")) useElmahIoLocation = expression.GetLocation();
        }, SyntaxKind.InvocationExpression);

        cb.RegisterCodeBlockEndAction(ctx =>
        {
            // EIO1001 will catch this
            if (!calls.Contains("UseElmahIo")) return;

            var index = calls.IndexOf("UseElmahIo");

            var useDeveloperExceptionPageIndex = calls.IndexOf("UseDeveloperExceptionPage");
            var useExceptionHandlerIndex = calls.IndexOf("UseExceptionHandler");
            var useAuthorizationIndex = calls.IndexOf("UseAuthorization");

            if (useDeveloperExceptionPageIndex != -1 && index < useDeveloperExceptionPageIndex)
                Report(ctx, useElmahIoLocation, "UseDeveloperExceptionPage");
            else if (useExceptionHandlerIndex != -1 && index < useExceptionHandlerIndex)
                Report(ctx, useElmahIoLocation, "UseExceptionHandler");
        });
    });
}
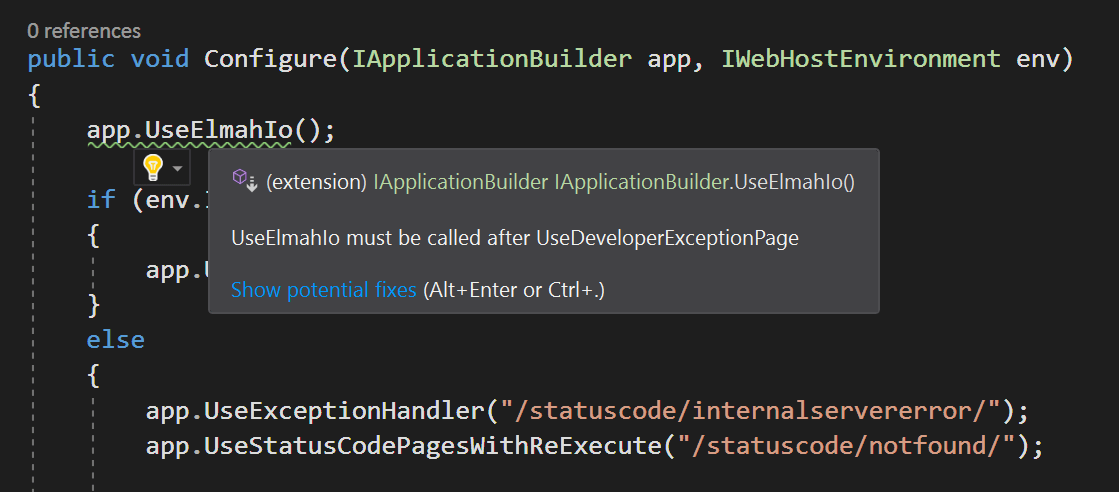
To test the analyzer, make sure to set the VSIX project as the startup project and hit F5. This will start an experimental instance of Visual Studio. Create a new ASP.NET Core project or open an existing one and navigate to the Startup class. When adding the UseElmahIo call before UseDeveloperExceptionPage the warning is shown in Visual Studio:
Multiple analyzers can be distributed in the same VSIX and/or NuGet package. Visual Studio automatically picks up all analyzers in installed packages.
That's it! The next step is for you to start experimenting with Roslyn Analyzers for your middleware.
elmah.io: Error logging and Uptime Monitoring for your web apps
This blog post is brought to you by elmah.io. elmah.io is error logging, uptime monitoring, deployment tracking, and service heartbeats for your .NET and JavaScript applications. Stop relying on your users to notify you when something is wrong or dig through hundreds of megabytes of log files spread across servers. With elmah.io, we store all of your log messages, notify you through popular channels like email, Slack, and Microsoft Teams, and help you fix errors fast.

See how we can help you monitor your website for crashes Monitor your website