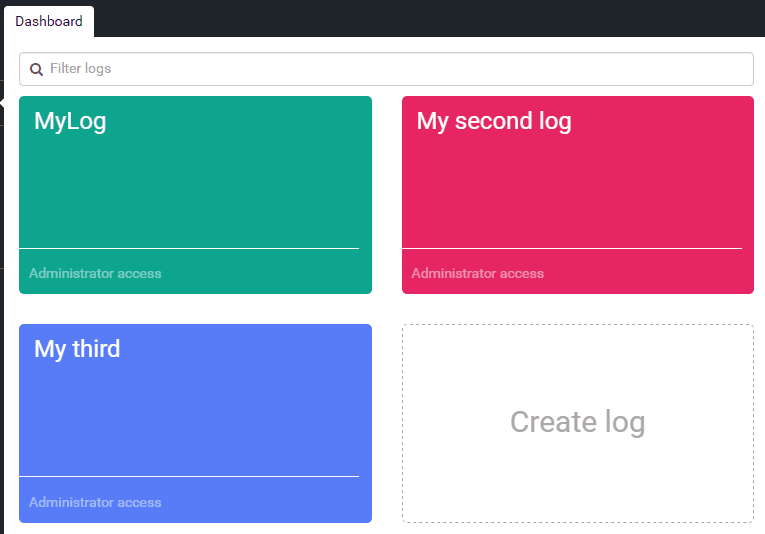
Redesigned Dashboard with Drag and Drop
The Dashboard is probably the first elmah.io page you saw after signing up. What we've tried to do in the Dashboard, is to show you an overall view of your logs. Thanks to you, the users, the dashboard has improved over time with both shortcut buttons, inline editing, and custom coloring. With the latest bunch of improvements, the Dashboard has become even better.
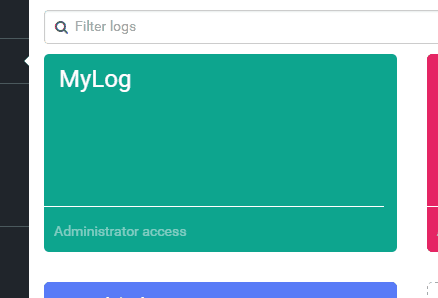
We've received a lot of requests for ordering logs on the dashboard. While the custom colors give some nice possibilities, being able to place related logs next to each other, means everything when having a lot of applications. That's why we've implemented just that using drag and drop:
Another request that we have heard from time to time, is the option to cancel editing a log. With the new log editor, there's a close button and we made it more visible which log you are editing, using a nice animation effect:
We hope that you will love the redesigned Dashboard as much as we have loved building it.
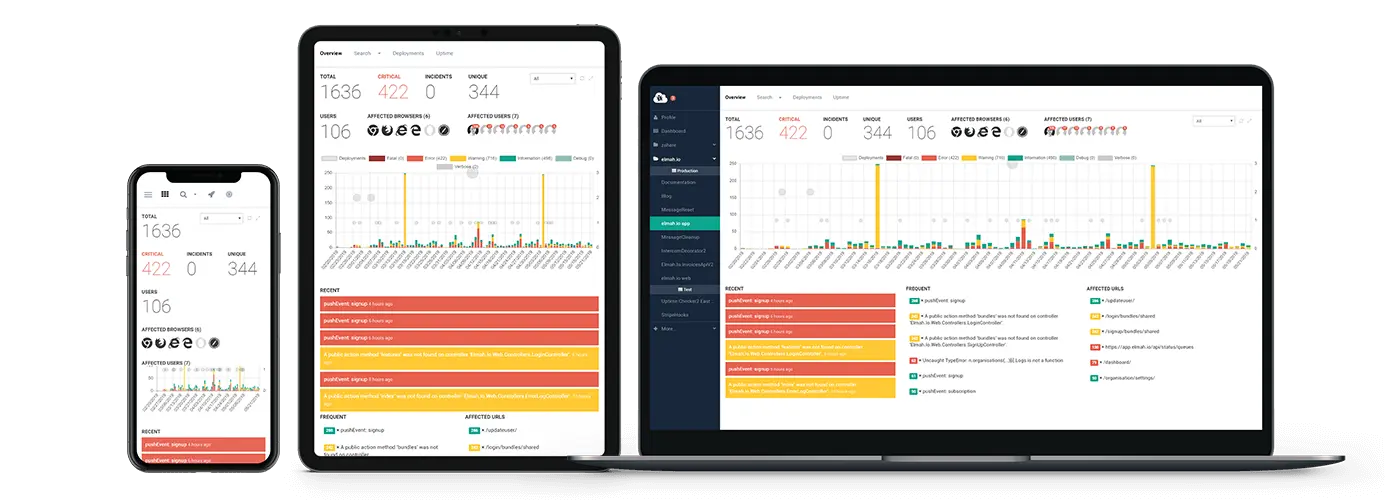
elmah.io: Error logging and Uptime Monitoring for your web apps
This blog post is brought to you by elmah.io. elmah.io is error logging, uptime monitoring, deployment tracking, and service heartbeats for your .NET and JavaScript applications. Stop relying on your users to notify you when something is wrong or dig through hundreds of megabytes of log files spread across servers. With elmah.io, we store all of your log messages, notify you through popular channels like email, Slack, and Microsoft Teams, and help you fix errors fast.
See how we can help you monitor your website for crashes Monitor your website